- Intoduction.
In a basis the analysis of activity of the enterprises of the food industry, often, methods of synthesis and comparison are applied. However for these methods there is a number of serious shortcomings, such as a significant amount of the indicators estimating efficiency from the economic point of view, and also a lack of communications of cause and effect character between the studied characteristics of activity of the organization. Therefore we will apply the factorial analysis to a complex assessment of activity of the enterprises of the food industry. Further we will present definition of the factorial analysis — a technique of studying of influence of various factors in activity of the organization on a productive indicator, taking into account the principle of complexity and systemacity. Proceeding from this definition, we will present a research technique which will allow to allocate the major factors exerting impact on level of quality of products.
The procedure of the factorial analysis as bases of the majority of researches contains three obligatory elements in the basis: 1. The researcher who acts as the subject. 2. An object, in our example is activity of the organization as system social and economic. 3. The received factors on the basis of which the researcher can define the directions of development of the organization. Therefore one of the main advantages of the factorial analysis complexity and recurrence belongs, that is stages consistently replace each other and allow to obtain detailed information on the studied object.
- Materials and methods.
The study of the pacing factors defining perceptions of factors of quality of food products was carried out on the following stages:
- The list of the main components of perception of quality for customers is defined. The task force is created of 50 people. On the basis of researches 16 component perceptions of quality of food products for customers were revealed. (X1-X16).
- Results of a research of food products component perception of quality for customers is exposed to factor analysis of methods of the principal components in the Minitab 16 program for the purpose of separation of the most important components quality perception which require special attention from the enterprises vendors for formation of positive perception of meat production.
- For determination of quantity of factors we will use: the percent of the explained dispersion of a factor shall be more, than 100% / quantity of variables = 100% / 16 = 6,25%, i.e. only those factors which share more than 6,25% are taken into account. Also the index – own value which value for switching on in calculation shall be more than 1,0 can be used. On the basis of the diagram it is recommended to select 2, 3 factors (a figure 1), value of «own value» confirm such choice (6,79; 1,55; 1,36). Thus, we make the decision on switching on in model of 3 factors.
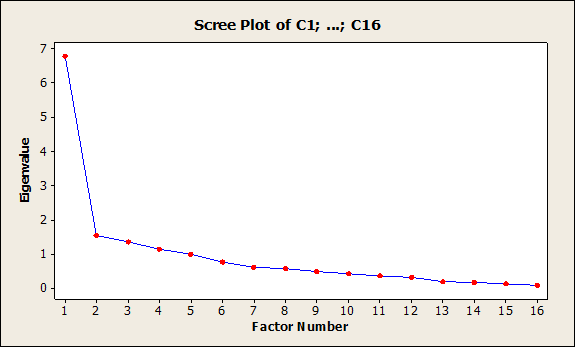
Figure 1. the Diagram of «a stony talus»
- From data of correlation matrix (table 1) it is visible that the highest value of correlation is watched between the variables X1 and X2, X1 and X10, X1 and X11, X1 and X12, X2 and X8, X2 and X10, X2 and X13 X2 and X14, X3 and X4, X3 and X10, X3 and X15, X4 and X10, X4 and X15, X5 and X6, X8 and X9, X10 and X13, X10 and X14, X10 and X15, X12 and X16, X13 and X15.
Table 1
Factor analysis of results of an assessment of the main components
|
Correlation analysis |
|||||||||||||||||||||||||
| X1 | X2 | X3 | X4 | X5 | X6 | X7 | X8 | X9 | X10 | X11 | X12 | X13 | X14 | X15 | X16 | ||||||||||
| X1 | 1,0 | ||||||||||||||||||||||||
| X2 | ,526 | 1,0 | |||||||||||||||||||||||
| X3 | ,402 | ,565 | 1,0 | ||||||||||||||||||||||
| X4 | ,478 | ,315 | ,764 | 1,0 | |||||||||||||||||||||
| X5 | ,417 | ,278 | ,429 | ,471 | 1,0 | ||||||||||||||||||||
| X6 | ,265 | ,161 | ,406 | ,381 | ,666 | 1,0 | |||||||||||||||||||
| X7 | ,342 | ,309 | ,375 | ,398 | ,501 | ,696 | 1,0 | ||||||||||||||||||
| X8 | ,436 | ,610 | ,396 | ,330 | ,309 | ,288 | ,503 | 1,0 | |||||||||||||||||
| X9 | ,388 | ,366 | ,409 | ,300 | ,385 | ,370 | ,357 | ,544 | 1,0 | ||||||||||||||||
| X10 | ,540 | ,503 | ,511 | ,582 | ,328 | ,313 | ,344 | ,446 | ,336 | 1,0 | |||||||||||||||
| X11 | ,505 | ,164 | ,318 | ,383 | ,482 | ,416 | ,389 | ,153 | ,312 | ,372 | 1,0 | ||||||||||||||
| X12 | ,586 | ,294 | ,328 | ,268 | ,355 | ,190 | ,258 | ,299 | ,393 | ,273 | ,419 | 1,0 | |||||||||||||
| X13 | ,443 | ,540 | ,409 | ,401 | ,372 | ,390 | ,438 | ,353 | ,373 | ,636 | ,390 | ,203 | 1,0 | ||||||||||||
| X14 | ,492 | ,519 | ,330 | ,220 | ,220 | ,362 | ,242 | ,417 | ,273 | ,572 | ,285 | ,248 | ,458 | 1,0 | |||||||||||
| X15 | ,416 | ,362 | ,520 | ,554 | ,452 | ,514 | ,354 | ,275 | ,379 | ,587 | ,417 | ,215 | ,508 | ,432 | 1,0 | ||||||||||
| X16 | ,282 | ,138 | ,177 | ,229 | ,146 | ,231 | ,389 | ,103 | ,062 | ,326 | ,453 | ,541 | ,248 | ,258 | ,349 | 1,0 | |||||||||
| Preliminary estimates of communities; own values of a matrix of correlation: sum = 16 | |||||||||||||||||||||||||
| X1 | X2 | X3 | X4 | X5 | X6 | X7 | X8 | X9 | X10 | X11 | X12 | X13 | X14 | X15 | X16 | ||||||||||
| Соб. mea | 6,79 | 1,55 | 1,36 | 1,14 | 1,00 | 0,77 | 0,61 | 0,58 | 0,48 | 0,41 | 0,36 | 0,32 | 0,19 | 0,17 | 0,12 | 0,08 | |||||||||
| Share | 42,4 | 9,7 | 8,5 | 7,2 | 6,3 | 4,8 | 3,8 | 3,6 | 3,1 | 2,6 | 2,3 | 2,0 | 1,2 | 1,1 | 0,8 | 0,5 | |||||||||
| Model of factors | |||||||||||||||||||||||||
| Factor 1 | Factor 2 | Factor 3 | Factor 1 | Factor 2 | Factor 3 | ||||||||||||||||||||
| X1 | -0,727 | -0,108 | 0,347 | X9 | -0,600 | -0,123 | -0,140 | ||||||||||||||||||
| X2 | -0,648 | -0,567 | 0,069 | X10 | -0,751 | -0,247 | 0,091 | ||||||||||||||||||
| X3 | -0,720 | -0,135 | -0,203 | X11 | -0,613 | 0,454 | 0,233 | ||||||||||||||||||
| X4 | -0,697 | 0,052 | -0,189 | X12 | -0,542 | 0,195 | 0,577 | ||||||||||||||||||
| X5 | -0,660 | 0,356 | -0,311 | X13 | -0,700 | -0,167 | -0,047 | ||||||||||||||||||
| X6 | -0,641 | 0,424 | -0,436 | X14 | -0,610 | -0,321 | 0,190 | ||||||||||||||||||
| X7 | -0,660 | 0,301 | -0,254 | X15 | -0,716 | 0,080 | -0,117 | ||||||||||||||||||
| X8 | -0,623 | -0,406 | -0,099 | X16 | -0,446 | 0,419 | 0,575 | ||||||||||||||||||
| The dispersion explained with each factor | |||||||||||||||||||||||||
| Factor 1 | Factor 2 | Factor 3 | |||||||||||||||||||||||
| 6,78 | 1,55 | 1,36 | |||||||||||||||||||||||
| 0,424 | 0,09 | 0,08 | |||||||||||||||||||||||
| Rated coefficients of value of factors | |||||||||||||||||||||||||
| Factor 1 | Factor 2 | Factor 3 | Factor 1 | Factor 2 | Factor 3 | ||||||||||||||||||||
| X1 | -0,107 | -0,070 | 0,255 | X9 | -0,088 | -0,079 | -0,102 | ||||||||||||||||||
| X2 | -0,095 | -0,366 | 0,051 | X10 | -0,111 | -0,160 | 0,067 | ||||||||||||||||||
| X3 | -0,106 | -0,087 | -0,149 | X11 | -0,090 | 0,293 | 0,171 | ||||||||||||||||||
| X4 | -0,103 | 0,034 | -0,139 | X12 | -0,080 | 0,126 | 0,424 | ||||||||||||||||||
| X5 | -0,097 | 0,230 | -0,229 | X13 | -0,103 | -0,108 | -0,034 | ||||||||||||||||||
| X6 | -0,094 | 0,274 | -0,320 | X14 | -0,090 | -0,207 | 0,139 | ||||||||||||||||||
| X7 | -0,097 | 0,194 | -0,186 | X15 | -0,105 | 0,051 | -0,086 | ||||||||||||||||||
| X8 | -0,092 | -0,262 | -0,073 | X16 | -0,066 | 0,271 | 0,423 | ||||||||||||||||||
On the basis of the analysis of model of factors it is possible to draw a conclusion that rather high value of correlation for a factor 1 is watched between the X1 variables (appearance of a product) X3 (consistence), X4 (color) of X10 (storage life) of X13 (rating), X15 (range). These variables characterize appearance food izdeliy can be visually evaluated by a customer directly during acquisition in trade retail network, and also estimate these markings. Therefore these variables allow to estimate quality food изделийс the points of view of appearance and from the point of view of requirements to storage conditions and composition which are regulated in the normative document, this factor can be called «a visual assessment of quality of meat products». The second factor most of all correlates with the X2 variables (tastes), the highest value of correlation therefore this factor can be called as «flavoring advantages of meat products» is watched.
The third factor correlates with the X12 variables (popularity of manufacturer) X16 (advertizing activities and actions). From data retrieveds it is possible to draw the following conclusion that the factor 3 is responsible for different programs for formation of positive perception of the meat-processing enterprise and carrying out competent marketing policy on advance and advertizing of meat goods. It allows to build such system of marketing communications which would help them to fix necessary style, a brand, a logo in consciousness of customers, to show the social directivity. The third factor can be called as «efficiency of marketing communications».
- Results and Discussion
The technique of the factorial analysis is developed for determination of level of perception of quality of food products with a possibility of receiving factors of perception. In the course of approbation of a technique the most significant parameters of perception of quality in the market of food have been determined that allows to form on the basis of this analysis the production development strategy to domestic manufacturers in the conditions of ensuring food security. It is necessary to consider the factors revealed during the researches on the basis of which development of strategic plans of the enterprises is possible. It her quality will allow to ensure safety of products and improvement. Quality and safety of food for the state have to become the national idea, the priority project. Mechanisms of impact of socially responsible business are directed to increase in efficiency of economy and improvement of life of the population.