INTRODUCTION
The purpose of this study is to assess the competitiveness of organizations operating in the manufacturing sector and to study the possibilities of improving competitiveness by identifying the internal factors that constitute it.
The study included the main factors that affect the competitiveness of the organization, such as production productivity, cost management, product quality, technological innovation, customer satisfaction, and supply chain efficiency. Data collection was based on questionnaires and internal information of the organization, and statistical analysis was performed using the SPSS program. The results show that factors such as technological progress, customer satisfaction, and supply chain are at a weak level, which have a negative impact on competitiveness.
Therefore, it is recommended that the management of the organization implement policies and measures to ensure the organization’s market share and sustainable development by rationally managing the main factors that constitute competitiveness and making improvements with a strategic approach.
THEORETICAL OVERVIEW RESEARCH
The specific indicators of industrial competitiveness are used to determine and evaluate how well a company maintains and improves its competitiveness in its industry and market. These indicators are determined by taking into account many factors, such as the company’s strategy, operations, resource utilization, innovation, and external environmental influences. The main indicators used to measure competitiveness include the following:
- Productivity
- Capacity Utilization: Measures the percentage of the potential capacity of the company’s equipment that is being used.
- High utilization indicates that the operation is being carried out more efficiently.
- Product Output: The number, volume, and quality of products produced each day, month, or year. It can be measured in terms of time or resources spent per unit of product. (Porter, M. E, 1985)
- Cost Management
- Cost Management: Measures how effectively the total costs (materials, labor, equipment, distribution, etc.) spent on producing a company’s products are managed.
- Cost per Unit: The total cost of producing a unit of product. Competitiveness is about controlling and reducing this cost. (Horngren, C. T., Datar, S. M., & Rajan, M. V, 2015)
- Quality
- Product quality level: It shows the quality characteristics that distinguish it from its competitors. Quality measurement is determined by indicators such as production defect rates, customer satisfaction, returns, and product performance.
- ISO certification: One way to assess the level of quality of a factory is to obtain international quality certification (ISO). (Juran, J. M., & Godfrey, A. B, 1999)
- Innovation and Technology Development (Innovation and Technology Development)
- New product development time: Measuring the time it takes a factory to produce a new product is an important indicator of competitiveness. It determines the ability to respond quickly to the market.
- Technological innovation: The level of use of new technologies in the industry, innovation processes such as automation and digital transformation, improve competitiveness. ( Schumpeter, J. A. 1934).
- Supply Chain Efficiency
- Supply chain costs: Costs of raw materials, distribution of products, warehousing, etc. A highly efficient supply chain improves competitiveness.
- Supply chain speed: The speed at which a company can deliver its products to the market is one of the indicators that determine its competitiveness.
(Chopra, S., & Meindl, P, 2016).
- Brand Recognition
- Brand Value: How consumers perceive and value a product or service is an important indicator of competitiveness. Customer satisfaction and brand loyalty are clear indicators of this. (Kotler, P., & Keller, K. L, 2016).
- Customer Satisfaction.
- Customer Feedback and Ratings: The quality of a product, its level of service, and its ability to meet market needs can be measured through customer feedback, ratings, and surveys.
- Return Rate: The percentage of customers who return a product. A low rate indicates good product quality and customer satisfaction. .(Kotler, P., & Keller, K. L, 2016).
- Market Position
- Market Share: A measure of the percentage of the market that a company’s products occupy. A high market position indicates a competitive advantage.
- Competitor Comparison: Compare the company’s competitive position with its competitors and the areas in which it competes. (Grant, R. M, 2016).
- Social Responsibility and Sustainability
- Sustainability performance: A company’s environmental performance and how it implements its sustainable development activities can be an indicator of its competitiveness.
- Social Responsibility Activities: Sustainable products and activities for the good of society create a positive impression on consumers and increase brand value. (Elkington, J, 1997).
- Financial Performance
- Revenue and Profitability: A company’s revenue and profitability are important indicators of its competitiveness. Financial stability and profitable growth are indicators of its competitiveness.
- Debt Burden: The financial position and level of debt of an organization are also related to its competitiveness. Reducing the amount of debt reduces risk and allows for sustainable development. (Brigham, E. F., & Ehrhardt, M. C, 2013).
RESEARCH SECTION
“Soyolon International” LLC is a nationally invested company established in Mongolia in 2012 and operates in the fields of mining engineering, technical services, production, plant installation, operation, and supply. The company is a group company and operates at the Salkhit silver deposit located in Gurvansaikhan soum, Dundgovi aimag.
Figure 1. “Soyolon International” LLC factory site
According to the theoretical basis methodology, the competitiveness study of the enterprise was conducted using the following indicators. These are:
- Productivity
- Cost Management
- Quality
- Innovation and Technology Development
- Supply Chain Efficiency
- Brand Recognition
- Customer Satisfaction
- Market Position
- Social Responsibility and Sustainability
- Financial Performance
The above indicators are used to examine the research in depth. Also, when assessing competitiveness, expert methods are used and 4-5 are considered as high levels, 3-4 as medium levels, and 1-2 as low levels.
- Factory productivity
The 2023–2024 productivity indicators of Soyolon International LLC, Oyu Tolgoi LLC, and Steppe Gold Ltd were compared and evaluated as follows.
Table 1
Production volume
| № | Factory location | Production volume (tons) | |
| 2023 | 2024 | ||
| 1 | “Soyolon International” LLC | 279,471.6 | 302,799.12 |
| 2 | “Oyu Tolgoi” LLC | 39.4m | 40m |
| 3 | Steppe Gold Ltd | 726,059 | 337,236 |
Table 2
Actual performance
| № | Factory location | Plan/
(tons) |
Performance/ (tons) | Average performance percentage | ||
| 2023 | 2024 | 2023 | 2024 | |||
| 1 | “Soyolon International”
LLC |
276,000 | 294,000 | 279,471.6 | 302,799.12 | 102.1 |
| 2 | “Oyu Tolgoi” LLC | 39.2m | 40m | 39.4m | 40m | 100 |
| 3 | Steppe Gold Ltd | 726,059 | 2.2m | 726,059 | 1.1m | 75 |
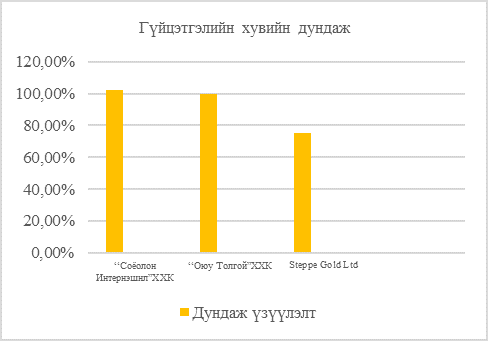
Figure 2. Actual performance (average performance percentage)
Table 3
Productivity
| Factory location | Total output | Total cost | Productivity | Competitiveness assessment |
| “Soyolon International”
LLC |
1.2 trill | 420 terb | 2.8 | 4 |
| “Oyu Tolgoi” LLC | 175.09terb | 61.2terb | 2.8 | 4 |
| Steppe Gold Ltd | 13.62 terb | 4.7tern | 2.8 | 4 |
From the above, it can be seen that although Oyu Tolgoi LLC is in the leading position in terms of plant productivity, when comparing output and costs, it is estimated that the three plants are at the same level in terms of competitiveness.
- Cost management
When assessing competitiveness through cost management, the ratio of total revenue to expenses of the plants is determined.
Table 4
Amount of money production costs
| Company | Total income | Total cost | Competitiveness assessment |
| “Soyolon International” LLC | 1.2 trill | 420 terb | 4 |
| “Oyu Tolgoi” LLC | 175.09 terb | 61.2 terb | 4 |
| Stepp Gold Ltd | 13.62 terb | 4.7 terb | 3 |
Note: The low cost for Oyu Tolgoi LLC and Stepp Gold Ltd is due to the fact that only the costs of silver production are taken into account, while for Soyolon International LLC, the amount of income and expenses depends on the direct customer company.
- Quality
The quality of the companies is determined by the main indicator of product yield.
Many factors influence the determination of the percentage of silver content in the concentrate. The level of content that is considered economically viable depends on the conditions of the mine, the cost of extraction, the market price and other factors.
ECONOMIC VALUE OF SILVER CONTENT:
The content of silver in the concentrate is usually expressed in grams per ton (g/t) or percent (%). The average content is classified as follows:
Table 5
Content classification in silver concentrates
| Content in silver concentrate | Description |
| 0.02% – 0.05% (200 – 500 g/t) | Profitable level (economic cut-off) |
| 0.05% – 0.1% and above | High content, high yield |
| < 0.01% (below 100 g/t) | May be economically inefficient |
International practice considers production of silver concentrates with grades of ≥0.02% (200 g/t) to be economically viable. However, this threshold may vary depending on factors such as mine conditions, technology, and cost structure.
Table 6
Comparison of metal production by industry
| Factory location | Performance (metal recovery %) | Plan (metal recovery,%) | Completion rate (%) | |||
| 2023 | 2024 | 2023 | 2024 | 2023 | 2024 | |
| “Soyolon International” LLC | 81.65 | 84.89 | 82.1 | 85.18 | 99.43 | 99.65 |
| “Oyu Tolgoi” LLC | 56.39 | 65.08 | 61.2 | 65.08 | 92.14 | 100 |
| Stepp Gold Ltd | 13.8 | 14.5 | 21 | 21 | 65.7 | 69.04 |
Table 7
Comparison of two-year averages
| Factory
site |
Completion rate (%) | Average performance | Competitiveness assessment | |
| 2023 | 2024 | |||
| “Soyolon International” LLC | 99.43 | 99.65 | 99.54 | 5 |
| “Oyu Tolgoi” LLC | 92.14 | 100 | 96.07 | 4 |
| Stepp Gold Ltd | 65.7 | 69.04 | 67.37 | 3 |
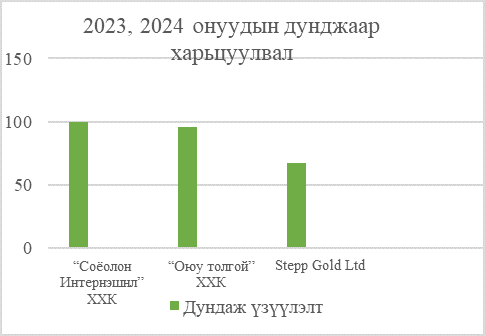
Figure 3. Comparison of averages for 2023 and 2024(average)
The metal recovery indicator is one of the criteria for indicating the quality of technological factors of the enterprise’s competitiveness. The fact that the Soyolon International LLC enterprise operates with a metal recovery of 99.5% compared to other enterprises indicates high technological efficiency, well-optimized enrichment operations, and high mining results. Therefore, this superior metal recovery indicator is a basis for concluding that the company’s production competitiveness is superior to others.
- Innovation and technology
Three leading companies in Mongolia’s mining sector – Soyolon International LLC, Oyu Tolgoi LLC, and Steppe Gold Ltd – successfully implemented technological innovations and equipment improvements in 2022–2024.
These innovations had a positive impact on their respective production efficiency, environmental impact, and cost savings.
The table below compares the characteristics of these companies’ technological innovations:
Table 8
Comparison of technological innovations
| Factory location | Update date | Technological innovation | Results of technological innovation | Rating |
| “Soyolon International” LLC | 2022-2024 | *Renovation of equipment for the concentrator.
*Improvement of mining techniques and equipment |
Increased capacity of the concentrator
Improved equipment reliability Reduced production costs |
3 |
| “Oyu Tolgoi” LLC | 2022-2024 | *Normet SmartDrive Utimec MF100 battery-powered vehicle
*Battery-powered equipment such as Epiroc Boltec E10 and Sandvik LH518iB *Thyssenkrupp high-performance belt conveyor systems |
*14+ units of battery-powered equipment put into operation
*Reduced smoke emissions and improved mine air quality *Reduced energy consumption and reduced environmental impact |
5 |
| Stepp Gold Ltd | 2022-2024 | *New 1,000 tph crushing plant
*110/35/10 kV high voltage power line connection *EPC contract signed with Hexagon and WSP |
Crushing capacity increased by 4 times
Energy costs reduced by 75% Annual production capacity can reach 4 million tons |
4 |
- Oyu Tolgoi: The introduction of battery-powered equipment has reduced the environmental impact and improved the air quality of the mine. It has also started a trial of battery replacement technology in collaboration with SPIC of China, which is a technologically advanced solution.
- Steppe Gold Ltd: Increased crushing capacity and reduced energy costs, improving production efficiency. Grid connection has significantly reduced operating costs.
- Soyolon International: Upgraded equipment at the concentrator has increased production capacity and reduced costs. However, advanced technological upgrades such as the introduction of battery-powered equipment have not yet been implemented.
These upgrades have had a positive impact on the operations of each company and are contributing to the development of the mining sector in Mongolia.
- Supply Chain
This document briefly describes the sources and frequency of supply of chemical reagents, spare parts and inventory for Oyu Tolgoi LLC, Steppe Gold Ltd, and Soyolon International LLC.
Table 9
Supply of reagents and spare parts
| № | Company | Suppliers | Supply frequency |
Competitiveness assessment |
| 1 | Oyu Tolgoi LLC | Chemical reagents and equipment are purchased from suppliers in China (Tianjin) and Mongolia (Ulaanbaatar). | Supplies are made on a regular basis, depending on the terms of the contract and the mine’s needs. | 5 |
| 2 | Steppe Gold Ltd | We source chemicals, reagents, and spare parts from international and domestic suppliers. | 4–6 months of reserves have been created, reducing supply risks. The frequency is regulated by contract. | 4 |
| 3 | Soyolon International LLC | Officially supplied by equipment manufacturers such as Eriez, Multotec, Sanme, and Ampco. | Delivered within the agreed time frame based on customer orders. | 3 |
“Soyolon International” LLC is a company that is an assembly and supply group company and has a fabric department that directly imports its spare parts and materials from external companies.
- Brand recognition (distinctiveness)
The differentiation of the Soyolon International LLC industrial site was compared based on the deposits it operates and other indicators. The characteristics and differentiation of the Oyu Tolgoi, the Viyyat silver deposit, and the silver deposits being mined by Steppe Gold Ltd vary in terms of mineral composition, mining technology, product type, investors, and export destinations.
Table 10
Comparison of differences
| № | Indicator | Oyu Tolgoi | Salkhit silver deposit | Steppe Gold Ltd (ATO орд) |
| 1 | Location | Khanbogd soum, Umnugovi aimag | Dundgovi aimag, Gobi-Ugtaal soum | Дорнод аймаг, Цагаан-Овоо сум |
| 2 | Basic minerals | Copper, gold, silver | Silver and gold | Silver and gold |
| 3 | Silver content | Medium-grade, released with copper concentrate | High-grade silver | Medium-grade silver |
| 4 | Production form | Combined open-pit and underground mining | Open pit mining and enrichment plant | Open pit mining and gravity enrichment |
| 5 | Үйлдвэрлэл эхэлсэн он | 2013 (deep mining from 2022) | 2020 | 2020 |
| 6 | Annual production (tons) | 25-30 tons | ~40 tons | 2–4 tons |
| 7 | Investor | Rio Tinto, Government of Mongolia | Government of Mongolia (100%) | With Canadian investment |
| 8 | Processing | It is found in copper concentrate. | Separates clean money | Produces gold and silver concentrates |
| 9 | Export direction | Exports concentrate to China | Net cash exports | China and other markets |
| 10 | Features | World-class copper-gold deposits and underground mines | Mongolia’s first pure silver processing plant | Low operating costs, planned for phased expansion |
| Competitiveness assessment | 4 | 5 | 2 | |
The Salkhit silver deposit, operated by the Soyolon International LLC industrial estate, is the first national project in Mongolia to have a pure silver processing plant, and it has a major advantage over other deposits. This deposit is characterized by its high concentration of silver, not just an accessory mineral. Since it went into operation in 2020, it has produced about 220 tons of pure silver per year and exported as pure products processed domestically, which is important for supporting economic independence and the development of the domestic value chain. The use of technology to separate silver in processing has a positive impact on product quality and export value.
In addition, as it is a 100% Mongolian state-owned project, it is important for economic independence as it is free from the influence of foreign investors and can develop in line with strategic policies.
- Delivery time
Mongolian mining and manufacturing companies, including Oyu Tolgoi, Soyolon International, and Step Gold, have varying experiences with time to market, contract fulfillment, and reasons for delays. The comparison below highlights the unique characteristics and challenges faced by each.
Table 11
Comparative evaluation of delivery times
| Company | Delivery time | Contract fulfillment | The main reason for the delay | Rating (1-5 points) |
| “Soyolon International” LLC | Unclear | Unclear | The problem of corruption at the management level | 2.5 |
| Oyu Tolgoi | Fixed term | It is possible. | Underground mining construction | 4.5 |
| Step Gold | Fixed term | Generally fulfilled | Legal disputes | 4 |
As of 2024, Erdenes Silver Resources LLC is operating mining and production operations at the Salkhit silver-gold deposit, with production reserves estimated at 870,497 tons. It is also conducting geological and exploration work in the areas with exploration licenses in Umnugovi and Bayankhongor aimags (erdenesgold.mn). However, corruption issues have arisen related to the company’s management, which may negatively affect delivery times and contract fulfillment (Dobu).
However, Oyu Tolgoi LLC and Stepp Gold Ltd are continuing to operate stably in 2024, and delivery times and contract fulfillment are expected to be met. This comparison shows that while Oyu Tolgoi and Stepp Gold are operating relatively stably, Erdenes Silver Resources LLC may face management-level issues that could lead to uncertainty regarding delivery times and contract fulfillment.
- Oyu Tolgoi LLC received a high score because it is the most stable and delivers on time.
- Stepp Gold Ltd received a small score deduction because its product supply is stable, but legal disputes pose a certain risk.
- Erdenes Silver Resources LLC had management issues and unstable supply negatively impacting its delivery time rating.
- Market share
Mongolia has processed a total of 3,032 tons of silver over the past two years, earning 8.7 billion tugriks in revenue. Of these, the highest shares of Mongolia’s export earnings over the past two years are:
- Soyolon International LLC-13%
- Oyu Tolgoi LLC-2%
- Stepp Gold Ltd-0.1% each.
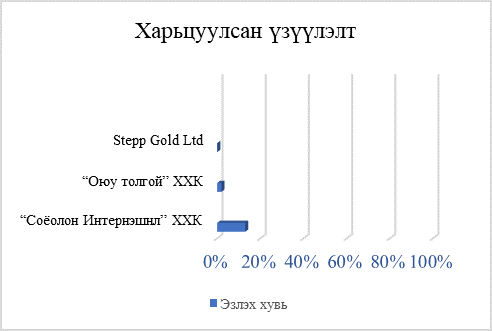
Figure 4. Mongolia’s share in exports (comparative figures)
Table 12
Competitiveness assessment
| Company | Competitiveness assessment |
| «Soyolon International» LLC («Erdenes Silver Resources» LLC) | 5 |
| Oyu Tolgoi | 4 |
| Stepp Gold Ltd | 2 |
- Sustainability and social responsibility
To assess the sustainability and competitiveness of the company in terms of social responsibility, a survey was conducted among the company’s senior executives and executives.
Demographics: age, gender, position, and work experience
| 6-10 years | 22 | 30.1 | 100.0 |
The majority of the respondents were between 20 and 40 years of age. Specifically, 37.0 percent of the respondents were between 20 and 30 years of age, and 38.4 percent of the respondents were between 31 and 40 years of age, accounting for 75.3 percent of the total respondents. 17.8 percent of the respondents were between 41 and 50 years of age, and 6.8 percent of the respondents were between 51 and 61 years of age.
In terms of gender, 72.6 percent were men and 27.4 percent were women. This indicates that the majority of the respondents were men.
In terms of job level, 90.4 percent of the respondents held executive positions, while 9.6 percent held managerial positions.
In terms of work experience, more than half of the respondents, or 52.1 percent, had 1-5 years of experience, while 30.1 percent had 6-10 years of experience, and 17.8 percent had 11 or more years of experience.
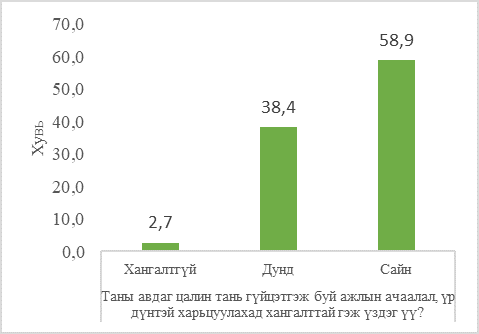
Figure 5. Do you think your salary is adequate compared to the workload and effectiveness of your work?
The figure shows that 58.9 percent of respondents rated their salary as «good» compared to their workload and performance, 38.4 percent rated it «average,» and only 2.7 percent rated it «inadequate.» This indicates that most employees consider their salary to be commensurate with their work.
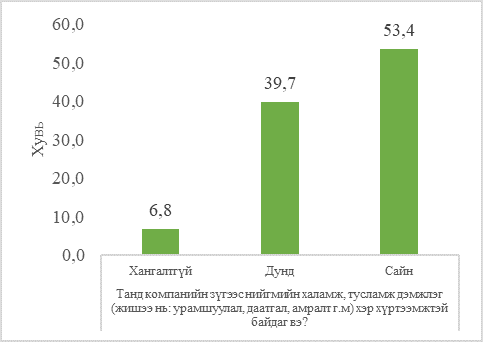
Figure 6. To what extent do you have access to social welfare and support (e.g., bonuses, insurance, vacation, etc.) from your company?
The figure shows that 53.4 percent of participants rated the company’s social welfare and support (incentives, insurance, vacation, etc.) as «good,» 39.7 percent as «average,» and 6.8 percent as «insufficient.»
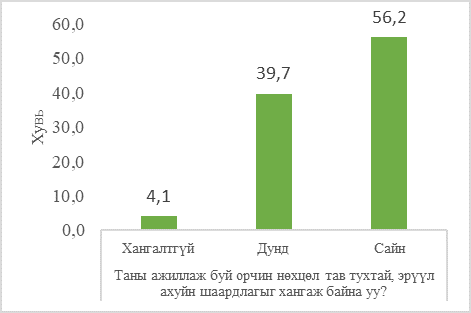
Figure 7. Is your working environment comfortable and meets hygiene requirements?
As can be seen from the figure, regarding the working environment, 56.2 percent of the participants considered the working environment to be comfortable and hygienic, while 39.7 percent said it was «average» and 4.1 percent said it was «insufficient.»
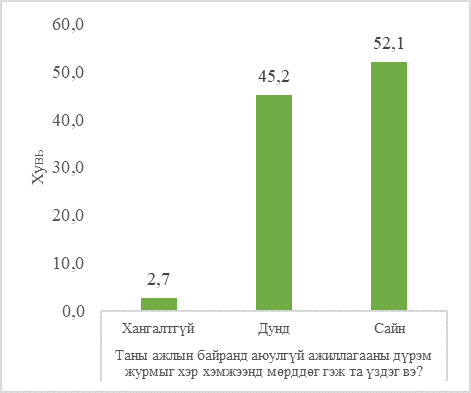
Figure 8. To what extent do you think safety regulations are followed in your workplace?
The figure shows that 52.1 percent of employees rated safety regulations as «good,» 45.2 percent as «average,» and 2.7 percent as «insufficient.» This indicates that most employees believe that safety regulations are relatively well followed.
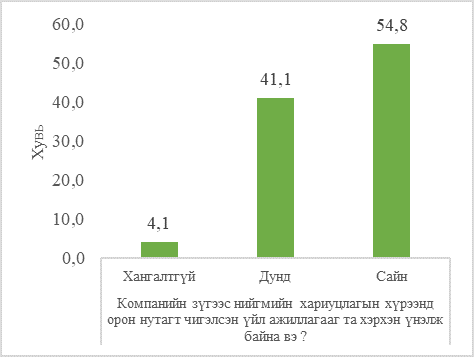
Figure 9. How do you evaluate the company’s community-oriented activities within the framework of social responsibility? (poor, average, good)
The figure shows that 54.8 percent rated the company’s community-oriented social responsibility activities as «good,» 41.1 percent as «average,» and 4.1 percent as «insufficient.»
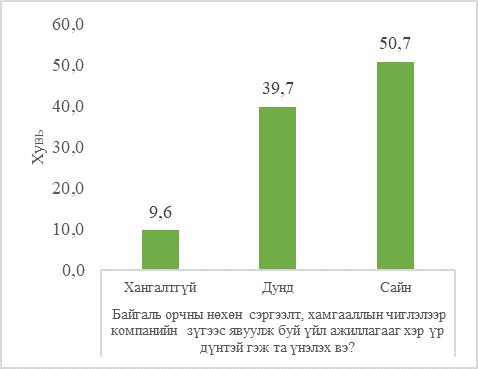
Figure 10. How effective would you rate the company’s environmental restoration and protection activities? (insufficient, average, good)
The figure shows that 50.7 percent rated environmental restoration and protection activities as «good,» 39.7 percent as «average,» and 9.6 percent as «insufficient.» This indicates that employees have a relatively positive attitude toward environmental issues.
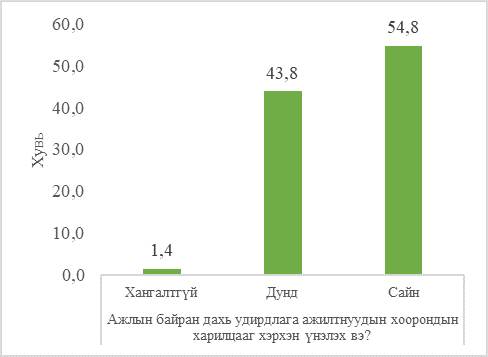
Figure 11. How would management rate the relationship between employees in the workplace? (poor, average, good)
The figure shows that 54.8 percent rated the relationship between management and employees in the workplace as «good», 43.8 percent as «average», and 1.4 percent as «insufficient», indicating that internal relations within the organization are at a good level.
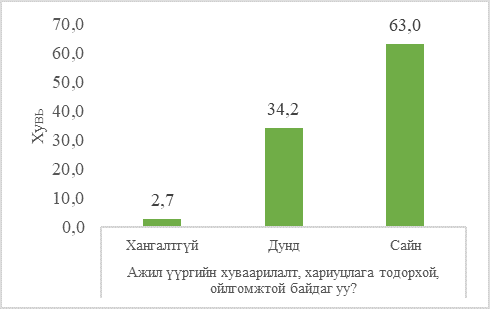
Figure 12. Is the distribution of duties and responsibilities clear and understandable? (poor, moderate, good)
As can be seen from the figure, 63.0 percent of the participants answered «good», 34.2 percent «average», and 2.7 percent «insufficient» regarding the clarity of the distribution of duties and responsibilities, indicating a common understanding of the clarity of duties and responsibilities.
- A correlation analysis was conducted between the satisfaction questions of the survey participants and groups such as age, gender, position, and years of service.
Respondent satisfaction questions and gender analysis
| Indicator | Sex | Total | р number | ||
| Male | Female | ||||
| How much social welfare and support do you have from your company (e.g., bonuses, insurance, vacation, etc.)? | Insufficient | 4 | 1 | 5 | 0.476 |
| Middle | 23 | 6 | 29 | ||
| Good | 26 | 13 | 39 | ||
| Is your working environment comfortable and meets hygiene requirements? | Insufficient | 2 | 1 | 3 | 0.869 |
| Middle | 22 | 7 | 29 | ||
| Good | 29 | 12 | 41 | ||
| To what extent do you think safety regulations are followed in your workplace? | Insufficient | 0 | 2 | 2 | 0.045 |
| Middle | 23 | 10 | 33 | ||
| Good | 30 | 8 | 38 | ||
| How do you evaluate the company’s local-oriented activities within the framework of social responsibility? | Insufficient | 1 | 2 | 3 | 0.294 |
| Middle | 22 | 8 | 30 | ||
| Good | 30 | 10 | 40 | ||
| How effective would you rate the company’s activities in environmental restoration and protection? | Insufficient | 5 | 2 | 7 | 0.568 |
| Middle | 23 | 6 | 29 | ||
| Good | 25 | 12 | 37 | ||
| How can management in the workplace evaluate relationships between employees? | Insufficient | 1 | 0 | 1 | 0.694 |
| Middle | 22 | 10 | 32 | ||
| Good | 30 | 10 | 40 | ||
| Are the distribution of duties and responsibilities clear and understandable? | Insufficient | 2 | 0 | 2 | 0.573 |
| Middle | 19 | 6 | 25 | ||
| Good | 32 | 14 | 46 | ||
The table shows that there is a statistically significant difference between genders in the level of compliance with safety regulations in the workplace (p = 0.045). Female employees tended to give an «insufficient» rating in this area, indicating a more negative attitude compared to men. This indicates the need to ensure that the organization’s safety regulations are equally accessible and understandable to all employees. However, no statistical differences were found for questions such as access to social welfare and support (p = 0.476), working conditions and hygiene requirements (p = 0.869), community-oriented activities within the framework of corporate social responsibility (p = 0.294), environmental restoration and protection activities (p = 0.568, relations between management and employees (p = 0.694), and understanding of the distribution of duties and responsibilities (p = 0.573).
Analysis of satisfaction questions and age group of respondents
| Indicator | Your age | Total | Р number | ||||
| 20-30 | 31-40 | 41-50 | More than 51 | ||||
| Do you think your salary is adequate compared to the workload and effectiveness of your work? | Insufficient | 1 | 1 | 0 | 0 | 2 | 0.703 |
| Middle | 7 | 12 | 7 | 2 | 28 | ||
| Good | 19 | 15 | 6 | 3 | 43 | ||
| How much social welfare and support do you have from your company (e.g., bonuses, insurance, vacation, etc.)? | Insufficient | 0 | 3 | 2 | 0 | 5 | 0.313 |
| Middle | 14 | 9 | 5 | 1 | 29 | ||
| Good | 13 | 16 | 6 | 4 | 39 | ||
| Is your working environment comfortable and meets hygiene requirements? | Insufficient | 0 | 1 | 1 | 1 | 3 | 0.421 |
| Middle | 13 | 11 | 4 | 1 | 29 | ||
| Good | 14 | 16 | 8 | 3 | 41 | ||
| To what extent do you think safety regulations are followed in your workplace? | Insufficient | 0 | 1 | 1 | 0 | 2 | 0.515 |
| Middle | 16 | 11 | 4 | 2 | 33 | ||
| Good | 11 | 16 | 8 | 3 | 38 | ||
| How do you evaluate the company’s local-oriented activities within the framework of social responsibility? | Insufficient | 1 | 2 | 0 | 0 | 3 | 0.729 |
| Middle | 13 | 10 | 4 | 3 | 30 | ||
| Good | 13 | 16 | 9 | 2 | 40 | ||
| How effective would you rate the company’s activities in environmental restoration and protection? | Insufficient | 2 | 2 | 3 | 0 | 7 | 0.563 |
| Middle | 11 | 10 | 6 | 2 | 29 | ||
| Good | 14 | 16 | 4 | 3 | 37 | ||
| How can management in the workplace evaluate relationships between employees? | Insufficient | 0 | 0 | 0 | 1 | 1 | 0.022 |
| Middle | 12 | 14 | 5 | 1 | 32 | ||
| Good | 15 | 14 | 8 | 3 | 40 | ||
| Are the distribution of duties and responsibilities clear and understandable? | Insufficient | 0 | 0 | 1 | 1 | 2 | 0.076 |
| Middle | 10 | 12 | 3 | 0 | 25 | ||
| Good | 17 | 16 | 9 | 4 | 46 | ||
Relationships between management and employees in the workplace (p = 0.022). There were statistically significant differences between age groups in this indicator. It is particularly evident that employees over the age of 51 rated this indicator slightly lower or “insufficient”, and there is a tendency to perceive a lack of support and understanding from management as they get older. This indicates the need for organizations to ensure that internal communication and a culture of cooperation are accessible to all ages. There were no statistically significant differences between age groups in all the criteria below. In other words, regardless of the age group of the employees, the evaluations were similar: Whether the salary is adequate compared to the workload and efficiency (p = 0.703), the availability of social welfare, assistance, and support (p = 0.313), the adequacy of the working environment and hygiene requirements (p = 0.421), compliance with safety regulations (p = 0.515), the evaluation of community-oriented activities within the framework of social responsibility (p = 0.729), the evaluation of environmental restoration and protection activities (p = 0.563), and the clarity of the distribution of duties and responsibilities (p = 0.076) were not statistically significant.
Respondents’ satisfaction questions and job-related analysis
| Indicator | Position | Total | р number | |||||||
| Executive position | Management position | |||||||||
| Do you think your salary is adequate compared to the workload and effectiveness of your work? | Insufficient | 2 | 0 | 2 | 0.879 | |||||
| Middle | 25 | 3 | 28 | |||||||
| Good | 39 | 4 | 43 | |||||||
| How much social welfare and support do you have from your company (e.g., bonuses, insurance, vacation, etc.)? | Insufficient | 1 | 4 | 5 | 0.000 | |||||
| Middle | 26 | 3 | 29 | |||||||
| Good | 39 | 0 | 39 | |||||||
| Is your working environment comfortable and meets hygiene requirements? | Insufficient | 2 | 1 | 3 | 0.166 | |||||
| Middle | 25 | 4 | 29 | |||||||
| Good | 39 | 2 | 41 | |||||||
| To what extent do you think safety regulations are followed in your workplace? | Insufficient | 2 | 0 | 2 | 0.171 | |||||
| Middle | 32 | 1 | 33 | |||||||
| Good | 32 | 6 | 38 | |||||||
| How do you evaluate the company’s local-oriented activities within the framework of social responsibility? | Insufficient | 3 | 0 | 3 | 0.221 | |||||
| Middle | 29 | 1 | 30 | |||||||
| Good | 34 | 6 | 40 | |||||||
| How effective would you rate the company’s activities in environmental restoration and protection? | Insufficient | 3 | 4 | 7 | 0.000 | |||||
| Middle | 27 | 2 | 29 | |||||||
| Good | 36 | 1 | 37 | |||||||
| How can management in the workplace evaluate relationships between employees? | Insufficient | 1 | 0 | 1 | 0.733 | |||||
| Middle | 28 | 4 | 32 | |||||||
| Good | 37 | 3 | 40 | |||||||
| Are the distribution of duties and responsibilities clear and understandable? | Insufficient | 2 | 0 | 2 | 0.387 | |||||
| Middle | 21 | 4 | 25 | |||||||
| Good | 43 | 3 | 46 | |||||||
Access to social welfare, assistance, and support (p = 0.000). A statistically significant difference was observed on this indicator between management and executive positions. In particular, the higher tendency of management officials to rate it as “insufficient” indicates that the social support policy and access for them may be weak. While the majority of executive employees gave a “good” rating, it indicates that management is dissatisfied. Also, environmental restoration and protection activities (p = 0.000). A statistical difference was also found on this criterion. The percentage of those rated “insufficient” is higher among management officials. This indicates that management officials may observe and evaluate the implementation of environmental policies more deeply. No statistical difference was found in the ratings of management and executive officials on the following criteria. This shows that their attitudes and assessments are common: There are no differences between executive and managerial employees in the questions on salary-to-workload ratio (p = 0.879), working environment and hygiene requirements (p = 0.166), compliance with safety rules and regulations (p = 0.171), community-oriented activities within the framework of social responsibility (p = 0.221), assessment of workplace relationships (p = 0.733), and clarity of job distribution and responsibilities (p = 0.387), so the company’s policies and activities are implemented in these areas in a relatively balanced manner.
Analysis of the relationship between satisfaction questions and years of service among respondents
| Indicator | Employment status | Total | р number | |||
| 1-5 years | Over 11 years | 6-10 years | ||||
| How much social welfare and support do you have from your company (e.g., bonuses, insurance, vacation, etc.)? | Insufficient | 1 | 3 | 1 | 5 | 0.025
|
| Middle | 19 | 5 | 5 | 29 | ||
| Good | 18 | 5 | 16 | 39 | ||
| Is your working environment comfortable and meets hygiene requirements? | Insufficient | 0 | 2 | 1 | 3 | 0.137 |
| Middle | 16 | 3 | 10 | 29 | ||
| Good | 22 | 8 | 11 | 41 | ||
| To what extent do you think safety regulations are followed in your workplace? | Insufficient | 0 | 1 | 1 | 2 | 0.274 |
| Middle | 19 | 3 | 11 | 33 | ||
| Good | 19 | 9 | 10 | 38 | ||
| How do you evaluate the company’s local-oriented activities within the framework of social responsibility? | Insufficient | 1 | 0 | 2 | 3 | 0.509 |
| Middle | 16 | 7 | 7 | 30 | ||
| Good | 21 | 6 | 13 | 40 | ||
| How effective would you rate the company’s activities in environmental restoration and protection? | Insufficient | 2 | 4 | 1 | 7 | 0.045 |
| Middle | 17 | 5 | 7 | 29 | ||
| Good | 19 | 4 | 14 | 37 | ||
| How can management in the workplace evaluate relationships between employees? | Insufficient | 0 | 1 | 0 | 1 | 0.088 |
| Middle | 13 | 7 | 12 | 32 | ||
| Good | 25 | 5 | 10 | 40 | ||
| Are the distribution of duties and responsibilities clear and understandable? | Insufficient | 0 | 2 | 0 | 2 | 0.040 |
| Middle | 12 | 4 | 9 | 25 | ||
| Good | 26 | 7 | 13 | 46 | ||
Access to social welfare and support (p = 0.025). The difference in the assessment of this indicator depending on the years of employment is statistically significant. In particular, the relatively high «insufficient» rating among those who have worked for more than 11 years indicates dissatisfaction that they do not receive sufficient care and support despite having worked for more years. Assessment of environmental restoration and protection activities (p = 0.045). The assessment of environmental activities varies depending on the length of service. For example, the highest «insufficient» rating among those who have worked for more than 11 years indicates that older employees may be critical of the implementation of environmental protection policies and activities. Clarity of task distribution and responsibilities (p = 0.040) Statistical differences are also observed for this indicator. The tendency of those who have worked for more than 11 years to assess it as «insufficient» may be related to the fact that the organizational structure, responsibilities, and organization are unclear and unclear to some employees. The differences in ratings were not statistically significant regardless of years of service for the following indicators. In other words, it shows that participants have a common understanding and rating regardless of length of service: Working environment and hygiene (p = 0.137), compliance with safety regulations (p = 0.274), community-oriented activities within the framework of social responsibility (p = 0.509), and management-employee relations (p = 0.088).
The majority of our survey participants were between 20 and 40 years old, with a male predominance. Most of the participants, 90.4 percent, were in executive positions, while the majority of them had worked for 1-5 years and 6-10 years. The survey results show that most employees are satisfied with factors related to salary, working conditions, social welfare, and safety. In addition, most employees consider the company’s social responsibility policy aimed at the local community and the environment to be effective, indicating that the organization has a good impact and attitude in the external environment.
Compliance with safety regulations in the workplace is rated poorly by women, while those who have worked for many years tend to rate the relationship between management and employees in the workplace as poor. The availability of social welfare, assistance, and support is high among senior employees, but those who have worked for many years are dissatisfied. Environmental restoration, on the other hand, is rated as «insufficient» by senior employees, and the distribution of tasks and clarity of responsibilities is rated as insufficient by many employees, which is statistically significant.
- Financial indicators
When evaluating the Soyolon International LLC industrial site based on price factors, we compared it with companies such as Oyu Tolgoi LLC and Stepp Gold Ltd, which are engaged in silver production in Mongolia.
Output of silver production companies to the Chinese market over the past 2 years (net silver)
| Year | “Soyolon International” LLC | “Oyu Tolgoi” LLC | Stepp Gold Ltd | Export volume |
| 2023 | 168 tons | 25.51tons | 2.22tons | 913tons |
| 2024 | 210tons | 40.41tons | 2.92tons | 2119tons |
The market price of 1 ton of silver in 2023 was approximately 2.5 billion tugriks, and in 2024 it was 3.09 billion tugriks. This price is based on the average international market price and does not take into account additional costs such as importing and processing in Mongolia (Bank of Mongolia)
Table 18
Amount of profit from money production
| Year | “Soyolon International” LLC | “Oyu Tolgoi” LLC | Stepp Gold Ltd | Export volume |
| 2023 | 494 terb | 65.32 terb | 5.68 terb | 2.2 trill |
| 2024 | 661 terb | 109.77 terb | 7.94 terb | 6.5 trill |
| Total profit | 1.2 trill | 175.09 terb | 13.62 terb | 8.7 trill |
Competitiveness assessment
| Company | Competitiveness assessment |
| «Soyolon International» LLC («Erdenes Silver Resources» LLC) | 5 |
| Oyu Tolgoi | 4 |
| Stepp Gold Ltd | 4 |
Overall results of the study
“Soyolon International” LLC Industrial Estate sets competitive prices that meet market demand and are acceptable to consumers, resulting in:
- A larger market share,
- A higher profit margin.
- This indicates that the pricing strategy of the organization is effective and that it offers consumers a reasonable combination of price and quality.
Therefore, in terms of price factors, the organization can be considered a highly competitive and effective player in the market.
Summary of Competitiveness Assessment
| №
|
Company
Competitive ability indicators |
“Soyolon International” LLC | “Oyu Tolgoi” LLC | Stepp Gold Ltd |
| 1 | Factory productivity | 4 | 4 | 4 |
| 2 | Cost Management | 4 | 4 | 3 |
| 3 | Quality | 5 | 4 | 3 |
| 4 | Innovation and Technology Development | 3 | 5 | 4 |
| 5 | Supply Chain Efficiency | 3 | 5 | 4 |
| 6 | Brand Recognition | 4 | 5 | 2 |
| 7 | Customer Satisfaction | 2.5 | 4.5 | 4 |
| 8 | Market Position | 5 | 5 | 2 |
| 9 | Social Responsibility and Sustainability | 4 | 4 | 4 |
| 10 | Financial Performance | 5 | 4 | 4 |
“Soyolon International” LLC evaluated the industrial site based on 10 factors and the 3 factors with the best rating and the 3 factors with the worst rating are as follows:
3 factors with good ratings:
- Quality — 5 points
- Market Position — 5 points
- Financial Performance — 5 points
3 factors with bad ratings:
- Customer Satisfaction — 2.5 points
- Innovation and Technology Development — 3 points
- Supply Chain Efficiency — 3 points
Conclusion
In order to improve the competitiveness of an organization, it is necessary to really assess internal factors and improve them systematically. According to the results of the research, the main factors that negatively affect the competitiveness of “Soyolon international” llc are low consumer motivation, insufficient technological innovation, and weak supply network efficiency. Also, despite the high competitiveness of product quality and market position, the inadequate after-sales service and customer complaint resolving system are issues that need management’s attention.
Therefore, it is advisable to improve the customer complaint resolution system, gradually introduce innovation and technological innovation, and optimize the supply chain by installing intelligent systems such as ERP. By implementing these measures, the competitiveness of the organization, customer satisfaction, and operational efficiency can be increased, and the market share can be further secured. The study findings are also of practical importance to organizations engaged in similar activities.
References
1. Brigham, E. F., & Ehrhardt, M. C. (2013). Financial Management: Theory & Practice (14th ed.). Cengage Learning.2. Chopra, S., & Meindl, P. (2016). Supply Chain Management: Strategy, Planning, and Operation (6th ed.). Pearson.
3. Elkington, J. (1997). Cannibals with Forks: The Triple Bottom Line of 21st Century Business. Capstone.
4. Grant, R. M. (2016). Contemporary Strategy Analysis: Text and Cases Edition (9th ed.). Wiley.
5. Horngren, C. T., Datar, S. M., & Rajan, M. V. (2015). Cost Accounting: A Managerial Emphasis (15th ed.). Pearson.
6. Juran, J. M., & Godfrey, A. B. (1999). Juran’s Quality Handbook (5th ed.). McGraw-Hill.
7. Kotler, P., & Keller, K. L. (2016). Marketing Management (15th ed.). Pearson Education.
8. Porter, M. E. (1985). Competitive Advantage: Creating and Sustaining Superior Performance. The Free Press.
9. Schumpeter, J. A. (1934). The Theory of Economic Development: An Inquiry into Profits, Capital, Credit, Interest, and the Business Cycle. Harvard University Press.