Methods: The data was collected using modified questionnaires adapted to the Organizational Culture Assessment Instrument (OCAI) based on the Competing Values Framework (CVF). These questionnaires aimed to measure clan, adhocracy, hierarchy, and market organizational cultures across 6 domains. Responses were structured using a Likert scale. Additionally, the questionnaire included demographic characteristics of participants, such as age, position, tenure at the healthcare organization, educational qualifications, and experience.
The target population of the study consisted of healthcare organization employees, with a sample size of 107 participants (N=107). This sample was divided into two categories: employees and clinical staff.
Results: The Cronbach's alpha coefficient (α-reliability statistic), which determines the content validity and reliability of the questionnaire, was between 0.6 and 0.8. In the coefficient was 0.69 for clan, 0.83 for adhocracy, 0.81 for hierarchy and 0.75 for market dimension. Compared to the previous studies in this area, these values were adequately reliable to conduct this study (Cameron and Quinn, 2006).
Conclusions: This study aims to provide a basis for a more accurate assessment of organizational culture, to improve its validation, and to provide a deeper understanding of the impact of organizational culture types. The results of the study revealed that clan culture is dominant in healthcare organizations. However, in some dimensions (Dominant Characteristics, Organizational Leadership, and Employee Management), in addition to clan culture characteristics, three other types of cultural characteristics were also found. It was also found that there were statistically significant differences in the strength of culture depending on the demographic characteristics of some respondents.
Introduction
The socio-cultural environment of the country determines the norms of behavior of people and employees of the organization through laws, rules, and social norms. Similarly, organizational culture, on the one hand, is a reflection of the traditional culture of the nation and people, and on the other hand, is a system of values, beliefs, norms, and behaviors that all employees accept and respect (Ya. Shuurav, 2015).
An organization is a set of resources united for a specific purpose, and this reflects the state of the system. (Kh. Purevdagva D.L., 2013, p.8) Therefore, the successful achievement of the goals set by the organization depends on the knowledge, experience, interpersonal relationships, and organizational culture of the employees. When an organization is established, organizational culture is also formed.
There is a tremendous history of published research where the Organizational Culture Assessment Instrument (OCAI) was used in various settings and results identified current and preferred culture dimensions. There is overwhelming evidence from scholarly researchers like Cameron & Quinn, 2006:2011, Schein, 2009:2010, and Denison, 2004 to suggest that leaders should be held accountable and responsible for understanding and leveraging their organization culture so that business outcomes are met.
This research study addresses the implementation of OCAI instrument on employees within an organization and the effects on the culture change as an outcome from the use of the OCAI.
The OCAI was used by the leader to gain a deeper understanding of the organizations’ current perceived culture.
The data collected from employees indicated the cultural gap in the organization’s present versus desired culture. The data was used to change the organizations’ beliefs, values, and basic underlying assumptions as a change in the organizational culture.
Of all the culture assessment approaches reviewed by the leader, the OCAI stood out due to its reputation in the academic community and its solid theoretical foundation which is based on the Competing Values Framework (Cameron & Quinn, 2011).
The OCAI was developed by Kim Cameron and Robert Quinn (2011) and is the world’s most popular instrument that helps organizations’ identify current and preferred organizational culture (Fox, 2013).
Substantial research has been resulted in the developing the OCAI. Cameron and Quinn (2006) developed the theoretical model of the Competing Values Framework which consists of four Competing Values that correspond with four types of organizational culture. Each organization has its own combination of these four types of organizational cultures. The ability to identify which of the four or the combination of the four types is identified by the completion of a short survey. This culture identification assessment is a valid approach to looking at organizational culture and the desire for cultural change. The OCAI is currently used by over 10,000 companies worldwide (2017). The OCAI is based on a theoretical model called the competing values framework [3].
The research found six main dimensions which formed the basis of their framework on organizational culture: dominant cultural characteristics, organizational leadership, employee management, organizational glue, strategic emphasis and criteria for success. These categories introduced two principal cultural dimensions, each with a competing value. The first dimension is determining if a company’s culture is internally or externally focused. The second dimension is whether organizations played with flexibility or with stability. When placed on two axes, these two dimensions form four quadrants, each representing a distinct set of organizational effectiveness indicators. A graphical display of the competing values framework can be found in Figure 1 [2].
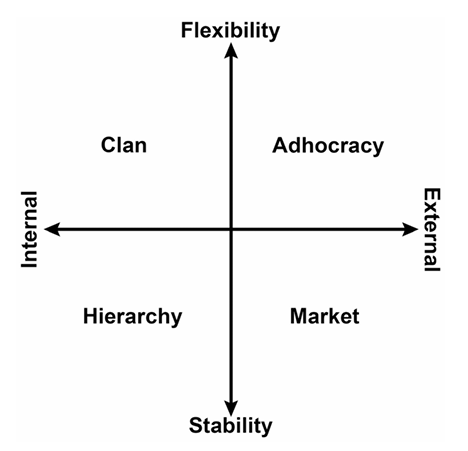
Figure 1. Factor structure of the OCAI reflective of the Competing Values Framework
Source: Cameron, K. S., & Quinn, R. E. (2006). Diagnosing and changing organizational culture: Based on the competing values framework (Revised ed.). San Francisco, CA: Jossey-Bass.
The four effectiveness criteria models are also called four organizational culture types [1,2]:
1) Clan: This culture focus on empowerment and employee evolvement, full of shared values and common objectives, an atmosphere of collectivity and mutual help.
2) Adhocracy: The adhocracy culture can be defined as a temporary institution, which is dismissed whenever the organizational tasks are completed and reloaded rapidly whenever new tasks emerge.
3) Hierarchy: The hierarchy culture has a clear organizational structure, standardized rules and procedures, strict control, and well-defined responsibilities
4) Market: The market culture focuses on the transactions with the environment outside the organization instead of on the internal management.
Using the OCAI, these four factors provide the basis of cultural classification within the workplace [1,2]. Additionally, the OCAI allows predictions to be made due to the process of reciprocal opposition [1,6], which in the context of this measure concern the factors diagonally opposite each other in Figure 1 (i.e., Clan and Market cultures, and Hierarchy and Adhocracy cultures). Nelson and Gopalan have previously noted that opposing clusters of values have been observed to carry inverted relationships with other outcome variables, and this notion has been applied to the OCAI factors’ expected relationships with other organizational variables [2,3,]. The conflicting cultural characteristics inherent in each diagonally-opposed factor have been supported by a managerial-level variant of the OCAI framework [2,3], as correlations between opposing factors were moderate-to-strong and negatively weighted. Therefore an important feature of the OCAI is not only that it describes organizational culture depending on alignments with the bisecting continua previously discussed, but that it also specifies the expected reciprocally opposing pattern of relationships between culture factors and other organizational variables of interest.
Purpose and Objectives
The purpose of the study was to describe the dominant culture type of Healthcare Organization. The study was designed as an evaluation survey for the purpose of exploring and describing Healthcare organizational culture. The researchers were also interested in studying if there was any variation in the strength of culture types according to demographic variables.
The study was guided by the following objectives.
- To describe the dominant culture type of Healthcare Organization from its Employees’ perspective. This objective was subdivided into:
- Describing the dominant culture type
- Describing the strength of the culture type;
- To find the difference between the culture types according to demographic variables
Methods
Study design
Data were collected by using a modified questionnaire which was adapted from the Organizational Culture Assessment Instrument (OCAI) based on CVF and consisting of 6 domains designed to measure the organizational cultures of Clan, Adhocracy, Hierarchy and Market. Responses were made on a Likert scale. In addition, the questionnaire contained questions about the demographic characteristics of the participants (Age, Position, Length of Service in the Healthcare Organization and Educational Qualifications and Experience). The questionnaire was distributed in both Mongolia and English language versions.
Participants
All employees working at the hospital were approached to collect data, and the sample size was 107 employees and clinical staff.
Research instrument
Permission was granted by the authors of the OCA for its use in this research study. The OCAI is a psychometric instrument developed by Kim Cameron and Robert Quinn of the University of Michigan (2011). Its purpose is to assist leaders with organizational change by helping identifying their current and preferred culture across six organizational culture dimensions. The survey provides a quantitative approach to describing culture related to a blend of four culturals (Clan, Adhocracy, Market, and Hierarchy). Responses were made on a Likert scale. In addition, the questionnaire contained questions about the demographic characteristics of the participants (Age, Position, Length of Service in the Healthcare Organization and Educational Qualifications and Experience). The questionnaire was distributed in both Mongolia and English language versions.
The results of the completed survey provides a means by which leaders can understand gaps between existing culture and desired culture known as cultural gaps (Fox, 2013; Cameron & Quinn, 2011). The OCAI instrument has been used in a variety of industry sectors, including health care, education, religious organizations, Federal and local governments, community colleges and universities, libraries, data warehouses, military organizations, recreational departments and many others (Cameron & Quinn, 2011 p.35).
Results
The Cronbach’s alpha coefficients (α-reliability statistic) ranged from 0.6 to 0.8.
The dominant type of culture as shown in table (1) for all respondents appeared to be the Clan culture with the highest mean scores, 3.86 for the whole sample and for the employees and the clinical staff, (3.81) and (4.00), respectively. To confirm these results, Mann-Whitney U was performed with the null hypothesis that there was no difference between the mean scores of the four types of culture across the employees and the clinical staff. The Mann–Whitney U test indicated that the four culture types were significantly different between staff as illustrated in table (1).
Table 1
Dominant type of culture in the healthcare verified by Mann–Whitney U test
| All respondents | Employees | Clinical Staff | Mann Whitney U |
Sig | |||
| Mean | Mean | mean rank | Mean | mean rank | |||
| clan | 3.863 | 3.81 | 120.98 | 4.00 | 120.04 | 8527 | .02 |
| adhocracy | 3.688 | 3.60 | 118.67 | 3.77 | 131.47 | 8315 | .016 |
| hierarchy | 3.750 | 3.73 | 110.30 | 3.81 | 130.74 | 8523 | .021 |
| market | 3.60 | 3.52 | 109.41 | 3.59 | 131.58 | 8283 | .014 |
If α is greater than 05, the null hypothesis will be accepted
Table (2) shows that the type of culture prevailing according to the age variable was the Clan culture with the highest mean score (4.05). To confirm this result, the Kruskal–Wallis test was performed with the null hypothesis that there was no difference between mean scores of age groups across the four types of culture. The test result confirmed that there was a statistically significant difference between culture types for different age groups. Pairwise comparisons were obtained from Mann-Whitney U to identify the age groups that differ in terms of mean across the four culture types.
Table 2
Types of culture according to age groups
| Clan | Adhocracy | Hierarchy | Market | |
| Less than 30 | 3.91 | 3.80 | 3.87 | 3.75 |
| 30-40 | 3.99 | 3.99 | 3.80 | 3.66 |
| 40-50 | 3.96 | 3.80 | 3.81 | 3.60 |
| 50-60 | 4.12 | 4.23 | 4.01 | 3.79 |
| 60 more | 4.29 | 4.10 | 4.24 | 3.60 |
| AVG | 4.05 | 3.98 | 3.95 | 3.68 |
| Kruskal-Wallis test | 13.40 | 10.92 | 15.99 | 14.27 |
| Sig* | .009 | .025 | .003 | .006 |
*The significant level is .05
In table (3) the Mann-Whitney test indicated the four culture types were significantly different between the group of 50 to less than 60 years and that of less than 30 years old. Also, the Mann-Whitney test indicated that the four culture types were significantly different between the age group 50 to less than 60 and 30 to Less than 40 years old. Only clan, market and hierarchy cultures proved to be significantly different between the age group 50 to less than 60. And that ranged between 40 to less than 50.
Table 3
The Mann-Whitney test result of age group Comparison
| Pairwise Comparisons | Clan | Adhocracy | Hierarchy | Market | |
| Less than 30 | mean rank | 46.70 | 46.35 | 45.78 | 40.70 |
| 50-60 | mean rank | 32.87 | 32.07 | 36.84 | 34.25 |
| Less than 30
versus 50–60 |
Mann Whitney U |
502 | 510 | 521 | 523 |
| Sig | .004 | .005 | .003 | .005 | |
| 30-40 | mean rank | 73.13 | 71.75 | 76.94 | 73.25 |
| 50-60 | mean rank | 100.98 | 93.59 | 106.52 | 100.48 |
| 30-40
versus 50–60 |
Mann Whitney U |
1360 | 1438 | 1340 | 1376 |
| Sig | .001 | .004 | .001 | .001 | |
| 40-50 | mean rank | 51.63 | — | 51.53 | 5160 |
| 50-60 | mean rank | 67.34 | — | 63.99 | 62.91 |
| 40-50
versus 50–60 |
Mann Whitney U |
965 | — | 954 | 963 |
| Sig | .014 | — | .012 | .014 |
In table (4) the dominant type of culture according to the years of work in the healthcare is Clan for all years of workgroups with the highest mean score (4.05). To confirm these results, a Kruskal–Wallis test was performed with the null hypothesis that there was no difference between means of culture types across the years of work groups. The test confirmed that there was no statistically significant difference between the culture types for years of work groups.
Table 4
Type of culture according to years of work in Healthcare organization verified by Kruskal Wallis Test:
| Years of work | Clan | Adhocracy | Hierarchy | Market |
| 1-4 | 3.93 | 3.72 | 3.75 | 3.80 |
| 4-7 | 4.15 | 3.99 | 3.79 | 3.89 |
| 7-10 | 4.01 | 3.85 | 3.90 | 3.9 |
| 10-13 | 3.90 | 3.75 | 3.76 | 3.82 |
| AVG | 4.00 | 3.83 | 3.80 | 3.85 |
| Kruskal-Wallis test | 8.73 | 8.95 | 5.46 | 7.71 |
| Sig. | .065 | .061 | .240 | .102 |
Table (5) shows that the highest mean scores according to years of experience was for clan culture across all years of experience groups. To confirm this result, a Kruskal–Wallis test was performed with the null hypothesis that there was no difference between the means of the four types of culture according to years of experience groups. The Kruskal–Wallis test showed that there was a statistically significant difference between the clan and hierarchy culture types between years of experience groups x2 (7) = 24.762 p=.001. To indicate which group can be considered as different from the other groups, a Mann–Whitney U test was performed as a post hoc test. The Mann-Whitney test showed there were significant differences between the dominance of Clan culture and the Hierarchy type in the (20.00–24.00 and 30.00–34.00) years of experience groups.
Table 5
Type of culture according to years of experience verified by Kruskal–Wallis test:
| Years of experience | < 5.00 | 5.00 — 9.00 | 10.00
— 14.00 |
15.00
— 19.00 |
20.00
— 24.00 |
25.00
— 29.00 |
30.00
— 34.00 |
35.00
— 39.00 |
Kruskal-Wallis test |
| Clan | 4.00 | 4.04 | 3.97 | 3.96 | 4.29 | 4.10 | 4.74 | 4.01 | .225 |
| Adhocracy | 3.87 | 3.84 | 3.78 | 3.87 | 4.16 | 3.81 | 4.74 | 4.01 | .162 |
| Market | 3.94 | 3.84 | 3.80 | 3.77 | 4.11 | 4.07 | 4.73 | 3.02 | .054 |
| Hierarchy | 3.94 | 3.90 | 3.75 | 3.64 | 4.07 | 4.07 | 4.98 | 3.00 | .001 |
The dominant type of culture according to qualifications as shown in table (6) is Clan for all respondents across qualifications categories, with the highest mean score (3.97). To confirm this result, a Kruskal–Wallis test was performed with the null hypothesis that there was no difference between the means of the four types of culture according to qualifications categories. The Kruskal–Wallis test confirmed that there were statistically significant differences between the clan and the adhocracy and the market culture types x2 (5) = 17.795 and 11.668, respectively, p=.003 and. 040. A Mann–Whitney U test was performed as a post-hoc test to indicate which education levels differed towards these culture types. The Mann-Whitney test showed that the adhocracy culture type was significantly different between PhD degree, (mean rank =72.45) and diploma (mean rank =55.55), U=1149.500, p =.028. The adhocracy culture type was significantly different between PhD degree (mean rank =76.74) and M.Sc. (mean rank =59.30, U=1445.500, p =.020).
Table 6
Type of culture according to qualifications
| Clan | Adhocracy | Hierarchy | Market | |
| Primary | 4.100 | 4.035 | 3.944 | 4.000 |
| Secondary | 4.015 | 3.844 | 3.844 | 3.861 |
| Diploma | 3.732 | 3.640 | 3.686 | 3.570 |
| Master | 3.913 | 3.711 | 3.675 | 3.447 |
| Doctorate | 4.118 | 3.932 | 3.974 | 3.749 |
| AVG | 3.976 | 3.832 | 3.825 | 3.725 |
| Kruskal–Wallis test | .054 | .003 | .053 | .040 |
Table (7) showed the highest mean scores on the organizational culture dimensions for the healthcare. The highest mean score was in the Dominant Characteristics dimension (Mean=4.125), while the lowest mean score recorded was in the Strategic Emphases dimension (Mean= 3.483). The cultural profile that shaped the healthcare proved to be composed of Clan, Market and Hierarchy cultures. To confirm this result, a Kruskal–Wallis Test was performed with the null hypothesis that there was no difference between the culture types across the dimensions. The test revealed that there was a statistically significant difference between the clan (dominant) and other three culture types for the following dimensions: Dominant Characteristics, Organizational Leadership and Management of Employees x2 (3) = 23.623,66.03 and 34.229, respectively, (p=0.000)
Table 7
The dominant culture on Organizational Culture Dimensions
| Dimensions | Mean scores | Type of culture | |||
| Clan | Adhocracy | Hierarchy | Market | ||
| Dominant Characteristics | 4.125 | 3.935 | 3.964 | 3.967 | Clan |
| Organizational Leadership | 3.868 | 3.864 | 3.723 | 3.255 | Clan |
| Management of Employees | 3.787 | 3.418 | 3.698 | 3.638 | Clan |
| Organization Glue | 4.102 | 3.987 | 4.048 | 4.090 | Market |
| Strategic Emphases | 3.483 | 3.728 | 3.819 | 3.786 | Hierarchy |
| Criteria of Success | 3.842 | 3.794 | 3.841 | 3.877 | Clan |
Discussion
This study used the CVF to measure and evaluate the OC of healthcare organizations, and the CVF was originally used to assess and evaluate the OC of companies. This model has also been used by other researchers, such as Scott, T. et al. (2003), Gershon, R. R. et al. (2004), and Stock, G.N., et al. (2007), to assess healthcare organizations and the validation of applicability in healthcare settings. This study found that clan culture was the dominant culture type from the perspective of healthcare organization members and received the highest mean score (3.97), which is consistent with other research findings. Clan culture emphasizes teamwork, employee participation programs, employee commitment, long-term benefits of individual development, as well as high cohesion, morale, and cooperation. This suggests that healthcare organizations are in a favorable position to change and improve their culture and management. The results also show that the characteristics of cultural types differ depending on employment, age group, years of service, and level of qualification, and that tribal culture corresponds to demographic characteristics.
This study demonstrated that CVF can be effectively used in health care organizations and highlighted the dominance of clan culture. Clan culture supports organizational culture and management by focusing on collaboration and employee development.
Suggestions for further research
The results of the study showed that the dominant culture in healthcare organizations was tribal culture, and this finding suggests that healthcare organizations need to reduce the weaknesses of tribal culture and enhance the strengths of other types of culture. Furthermore, it is recommended that researchers conduct comparisons between the private and public sectors using the CVF model or other tools mentioned above or other literature on the study of healthcare organization culture.
References
1. Cameron KS, Quinn RE (1999) Diagnosing and changing organizational culture: Based on the Competing Values Framework. Reading, MA: Addison-Wesley.2. Cameron KS, Quinn RE (2006) Diagnosing and changing organizational culture: Based on the Competing Values Framework. San Francisco, CA: Jossey-Bass.
3. Cameron, K. S., & Quinn, R. E. (2011). Diagnosing and changing organizational culture : based on the competing values framework.
4. Cooke, R., & Lafferty, J. (1989). Organizational Culture Inventory (OCI). Plymouth, MI: Human Synergistics.
5. Robert A. Cooke and Janet L. Szumal, Using the Organizational culture Inventory to Understand the Operating Cultures of Organizations
6. Hofstede, G. Attitudes, Values and Organizational Culture: Disentangling the Concepts. Institute for Research on Intercultural Cooperation, Maastricht and Tilburg, the Netherlands.
7. Akmaliah IF, Sensuse DI, Wulandari IA, Nurrohmah I, Imanda R, Cahyaningsih E, Noprisson H. Analyzing knowledge management in research laboratories based on organizational culture. In: Proceeding- 2017 3rd international conference on science in information technology: theory and application of IT for education, industry and Society in big Data era, ICSITech 2017, 2018 January; 2018. p. 278–83.
8. Scott, T., Mannion, R., Davies, H., & Marshall, M. "Organizational Culture in Health Care: A Review of the Literature" 2003
9. Gershon, R. R., Stone, P. W., Bakken, S., & Larson, E. "Measuring Organizational Culture in the Hospital Setting: Development and Validation of the Hospital Culture Scale" 2004
10. Helfrich CD, Li Y-F, Mohr DC, Meterko M, Sales AE (2007) Assessing an organizational culture instrument based on the Competing Values Framework: Exploratory and confirmatory factor analyses.
11. Stock, G. N., McFadden, K. L., & Gowen III, C. R. "The Competing Values Framework in Healthcare: Relationships Between Organizational Culture and Job Satisfaction in Pediatric Hospitals" 2007
12. Edgar H.Schein, Organizational Culture and Leadership. 4th edition. Published be Jossey Bass. A Wiley Imprint.989 Marketstreet. San Francisco. CA94103-174
13. Ariunaa Kh., Nyambayar Ch. (2023) Learning Styles and Cultural Differences: A comparative study of cultural differences in Austrian and Mongolian Students, Embedded Self Organizing Systems (Vol 10. No 7. 2023) (pp.95-101)
14. D. Buyan “Knowledge about Society”, Ulaanbaatar, Mon Sudar, 2006
15. G. Tseren “Organizational Behavior”, 2nd edition, Ulaanbaatar, New Indigo, 2021
16. N. Oyundalai, Ch. Behi “Organizational Psychology” Ulaanbaatar, Sodpress, 2017
17. T. Dorzhdagva “Cultural Studies” Ulaanbaatar, BIT Press, 2010
18. H. Purevdagva, D.L. “Change Management” Ulaanbaatar, Golden Eye Printing, 2013
19. Cronbach LJ (1951) Coefficient alpha and the internal structure of tests. Pyschometrika 16: 297–334.
20. Statistics Solution. (2019). Exploratory Factor Analysis - Statistics Solutions. Retrieved January 31, 2020
21. Measuring organizational culture: An empirical assessment of the hofstede questionnaire in a Mongolian setting (2011) from https://www.mongoliajol.info/index.php/PMAS/article/view/979