From the point of view of relief-forming factors, it is important to consider the morphometric indices of the relief of the Kerch Peninsula [7]. These include:
- Slope
- Stream power index
- Plan and Profile curvature
- Topographic Wetness Index
- Mass balance index
Slope of the surface is an indicator of the slope steepness, ratio of exceeding the parameters of the terrain relative to the surface on which it is observed; fixes the intensity of the height difference between two points on the surface. In mathematical terms, the slope of the surface is equal to the tangent of the angle between the rise of the slope and the horizontal surface (Figure 1) [13, 16].
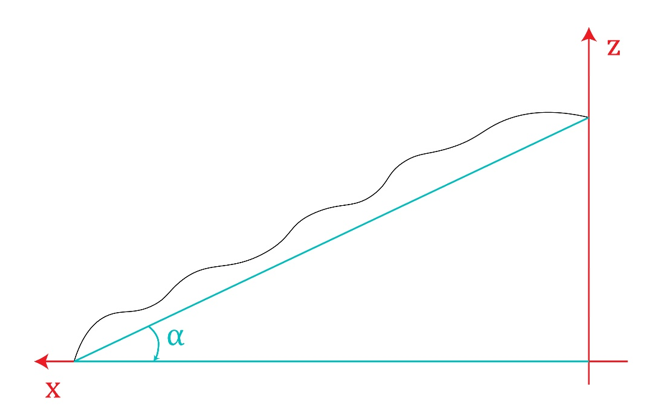
Figure 1. Schematic representation of the calculation of the slope of the surface
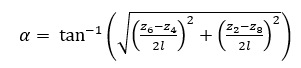
The determination of the slope angle of the surface according to the Zevenbergen-Thorn algorithm [17] is calculated by the formula 1:
 (1)
(1)
where z (2 … 8) — elevation indicators for certain raster cells, l — distance between individual height elements (spatial resolution of the raster). In this case, the units of absolute height and spatial resolution are equal to each other and as a rule are measured in meters.
For flat areas, such as territory of the Kerch Peninsula, V. Zhuchkova and E. Rakovskaya [1] proposed a classification of gradations of the surface slope (Table 1).
Table 1
Classification of slope by V. Zhuchkova and E. Rakovskaya
| Less than 1° | flat (subhorizontal) plains |
| 1-3° | Slightly inclined plains (very gentle slopes) |
| 3-5° | gentle slopes (inclined plains) |
| 5-7° | sloppy slopes |
| 7-10° | sloping slopes |
| 10-15° | strongly sloping slopes |
| 15-20° | steep slopes |
| 20-40° | very steep slopes |
| More than 40° | steep slopes |
The slope of the surface is a fundamental geomorphic parameter that is naturally associated with the following processes and landscape characteristics [7, 10]:
- surface runoff and drainage — the steeper the slope, the more intense of runoff and the less infiltration of moisture into the soil thickness. Thus, bias is of fundamental importance for the regime of soil moistening, especially — the upper layers;
- erosion — the intensity of erosion grows exponentially with increasing of the slope. This is explained by the fact that as the gradient increases, the kinetic energy of the sediments remains constant, but the transport accelerates in the direction of the foot. As a result, the kinetic energy of the runoff exceeds the kinetic energy of the sediments, when the slope goes over the mark of 8.5 °, which promotes the appearance of erosion processes;
- thickness of the soil profile on the slope naturally varies according to the slope and relative height. As a rule, the soil stratum is smaller in elevated inclined areas due to erosion processes and gravitational movement of the material, and gradually increases in the direction of the lowered areas with a slight slope;
- the amount of solar energy also depends on the slope, since it determines the angle of incidence of sunlight on the earth’s surface. Increasing the slope of the surface in the direction of sunlight increases the angle of their fall, and hence the amount of energy that the surface receives. This determines the microclimatic features of the site, in particular the temperature, evapotranspiration and moisture of the upper layers of the soil;
- features of the vegetation cover collectively reflect all of the above characteristics, since they directly or indirectly affect such edaphic factors as water and temperature regime of the soil, the mechanical composition of the root-containing layer, the content of nutrients, etc.
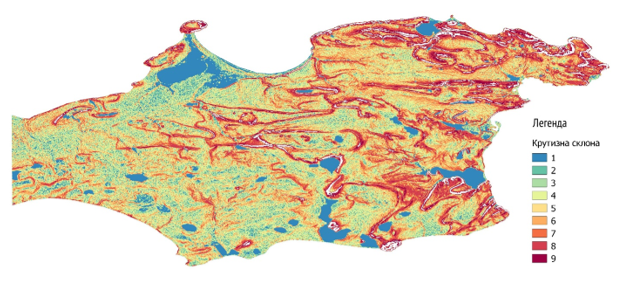
Figure 2. Steepness of the slopes of the Kerch Peninsula
Distribution by area occurred as follows in Table 2.
Table 2
Distribution of different classes of slopes steepness over the area
| Type of slope | Area, km2 |
| flat (subhorizontal) plains | 226,7391 |
| Slightly inclined plains (very gentle slopes) | 187,3897 |
| gentle slopes (inclined plains) | 289,7629 |
| sloppy slopes | 622,3431 |
| sloping slopes | 250,6452 |
| strongly sloping slopes | 570,7517 |
| steep slopes | 266,0778 |
| very steep slopes | 330,3291 |
| steep slopes | 107,7023 |
The largest area of the Kerch Peninsulas territory is occupied by sloppy slopes and strongly sloping slopes, having an area of 622 and 571 km2, respectively. Concerning the slopes on which there is the greatest probability of formation of landslides, their area is about 107 km2 and geographically they are located in the eastern part of the peninsula.
An important factor in the formation of landslides is a destructive effect of the underlying soil composition of atmospheric precipitation [2, 3]. With abundant deposition on the surface, short-term watercourses are formed, which lead to significant erosion processes, changes in soil composition and favorable conditions for the formation of landslides on the territory [6, 14].
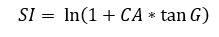
The steam power index (SPI) is calculated by the formula 2.
 (2)
(2)
where CA is the catchment area, G is the steepness of the slope.
In its essence, the flux power index is a measure of the potential erosive force of surface currents, i. e. the larger the catchment area and the slope, the greater the value of the SPI. Thus, the greater the volume of water entering a certain point of the surface from the areas above it and the higher the speed of these flows, the higher the probability of erosion processes.
SPI is used to describe the potential flow erosion at a given point on the topographic surface. If the catchment area and the slope angle increase, the amount of water falling on flat surfaces and the flow rate will increase, which will lead to an increase in flow capacity and intensification of erosion processes[4].
SPI rate depends on the erosion potential of the streams, the thickness of the soil horizons, the organic substances contained, the acidity of the soils, the content of silt and sand, and the nature of the vegetation cover.
Since the SPI depends on the slope, it is, as it were, its consequence in the part of the formation of the potential flow erosion parameter [9].
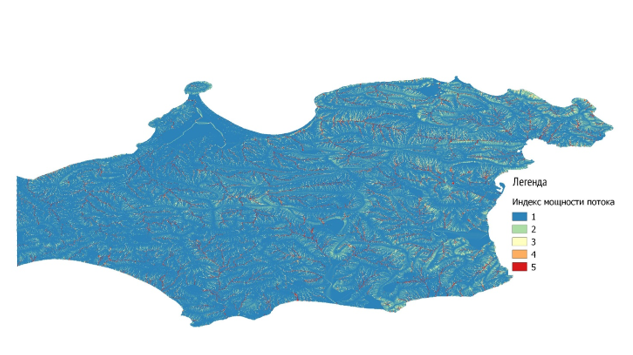
Figure 3. Calculated SPI of Kerch peninsula
Erosion processes on the territory of the Kerch Peninsula, which depend of atmospheric precipitation, are rather poorly developed.
Table 2
Distribution of SPI
| Class | Area, km2 |
| 1 | 2747,033 |
| 2 | 80,81874 |
| 3 | 28,52946 |
| 4 | 14,62019 |
| 5 | 17,09549 |
According to the table 2 territories, largely affected by this process have an area of 31 km2 or 1% of the total territory, which together with the fact that the level of precipitation on the Kerch Peninsula is very low, indicates a weak contribution of this factor to landslides process.
Plan curvature is the curvature of the line formed by the intersection of the earth’s surface and the vertical plane. Being a derivative of the second order, it describes the gradient of the slope along a given contour [5, 12].
Negative values of vertical curvature indicate the convexity of the surface. Positive values indicate that the surface is concave. Zero values are characteristic of a flat surface.
Plan curvature has a significant effect on the acceleration or deceleration of the flow across the entire surface. When the water flow accelerates, the amount of accumulated precipitation in the lower part of the slope increases, which leads to its considerable erosion.
Since vertical concave slopes lead to increased erosion processes, an increased level of erosion-type processes is observed on these slopes [16].
Profile curvature is the curvature of the line formed by the intersection of the earth’s surface with a plane perpendicular to the orientation direction of the maximum gradient (exposure). As a second-order derivative, the profile curvature describes the gradient of exposure along a given contour.
Positive values indicate that the surface is convex at a given point, while negative values indicate concavity.
Profile curvature, along with plan curvature, indicates a more dynamic course of processes of sliding of rock masses in concave areas of slopes.
The cumulative measure of the curvature of the earth’s surface, which identifies its convex sections with positive values, and concave — negative regardless of direction.
The imposition of plan and profile curvature leads to an increase in the total curvature of the surface. At those points where this value is maximal and the facts of the formation of significant landslides are observed.
The calculation of the curvature of the surface according to the Zevenbergen-Thorn [17] algorithm takes place according to formulas 3 and 4.
For plan curvature:
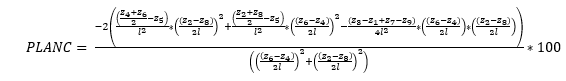 (3)
(3)
For profile curvature:
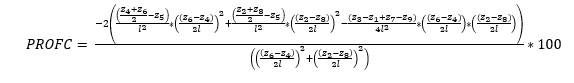 (4)
(4)
where z (2 … 8) — elevation indicators for certain raster cells, l — distance between individual height elements (spatial resolution of the raster).
The topographic wetness index (TWI) is usually used to study the on-going hydrological processes. The TWI helps to determine the areas on which due to various circumstances there is a waterlogging of the soils. According to K. Ballerin, TWI is an index that is able to show regions that are saturated with water or have a potential for this [8, 15, 16].
The index is calculated by the formula 5.
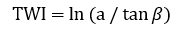 (5)
(5)
where, a is the specific catchment area; β is the slope angle (in radians)
The topographical character of the terrain affects not only the soil moisture, but also can indirectly affect its pH. These indicators are crucial for vascular plants. Also, TWI index correlates well with the level of groundwater and soil pH.
To calculate the values of the index of the topographic moisture index we can use spatial data, namely the digital terrain model.
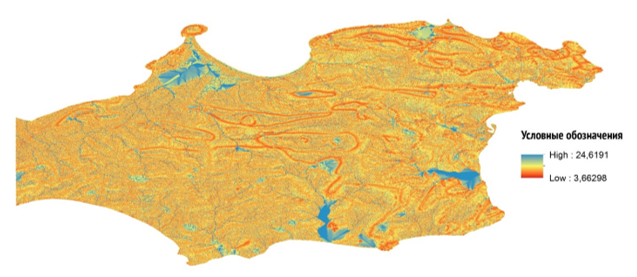
Figure 4. Calculated TWI of Kerch peninsula
An important indicator that characterizes the possibility of forming landslides is the mass balance index (MBI).
It shows the prerequisites for the development of dangerous gravity processes in a certain area and reflects the possible violation of the destruction of ground masses. By this indicator it is possible to identify dangerous landslides.
Negative values MBI the areas of the territory at which the deposition processes take place, for example, depressions and valleys. Positive values of MBI show erosion areas — convex slopes of hills. Values close to zero are confined to territories approximately equal to the level between erosion and sedimentation processes, which is characteristic of a flat terrain [11].
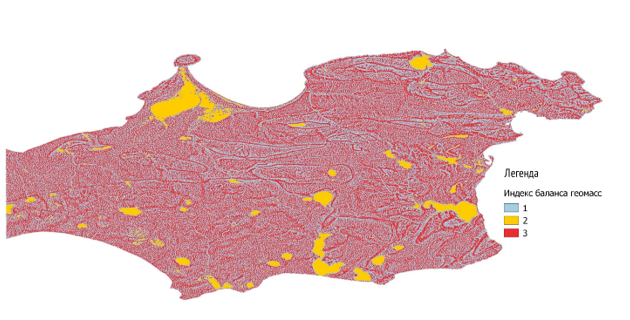
Figure 5. Calculated MBI of Kerch peninsula
MBI can be calculated by formula 6.
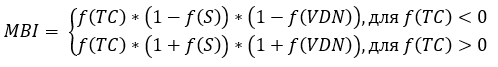 (6)
(6)
where, S — the slope angle indicator, TC — the index of the total curvature of the surface, VDN — the catchment area.
Thus, the territories on which the deposition processes take place occupy 1,440 km2, while the territories at which erosion processes are active are about 1,350 km2. In turn, the area of the territory occupied by flat areas of the terrain is only 151 km2.
Conclusion
Thus, it can be seen that the territory of the Kerch Peninsula has a rather heterogeneous relief. It is represented mainly by a weakly hilly terrain, for which a rather weak amount of precipitation is characteristic. The nature of the curvature shows that most spread types of territory are convex hilly regions. Potential areas where erosion can occur as a consequence of undermining precipitation is practically absent. This can significantly contribute to the active development of both erosion processes and landslides.
Most important factor for landslide process is slope angle. Territories with slope angles, that lead to landslides have an area about 450 km2 or 20% of the total area, that is a big value at all. That’s why morphometric parameters plays an important role in forming landslide territories in Kerch peninsula.
References
1. Жучкова В.К., Раковская Э.М. Методы комплексных физико-географических исследований. Учебное пособие для студентов ВУЗов / В.К. Жучкова, Э.М. Раковская, Москва: Академия, 2004. 368 c.2. Ивлиева О.В. [и др.]. Современные опасные экзогенные процессы в береговой зоне Азовского моря / О.В. Ивлиева, Е.В. Беспалова, И.В. Шевердяев, К.С. Сушко, Г.Г. Матишов [и др.]., Ростов-на-Дону: Южный федеральный университет, 2015. 321 c.
3. Комогоров А.Ю., Беспалова Л.А. Опасные экзогенные геологические процессы береговой зоны Керченского полуострова // I научная конференция студентов и молодых ученых с международным участием «Актуальные проблемы наук о земле». 2016. C. 264–266.
4. Семенова А.Ю. Здоровье населения в системе социальных, экологических и экономических процессов развития общества // Экономика и предпринимательство. 2016. № 10–3 (75–3). C. 1161–1166.
5. Ayalew L., Yamagishi H., Ugawa N. Landslide susceptibility mapping using GIS-based weighted linear combination, the case in Tsugawa area of Agano River, Niigata Prefecture, Japan // Landslides. 2004. № 1 (1). C. 73–81.
6. Aydın A., Eker R. Fuzzy rule-based landslide susceptibility mapping in Yığılca Forest District (Northwest of Turkey) // Journal Journal of the Faculty of Forestry Istanbul University Anahtar Kelimeler: FIS. 2016. № 662 (66). C. 559–571.
7. Krivoguz D. Methods of Evaluation for Region’s Landslide Susceptibility. Short Overview // Safety in Technosphere. 2017. № 3 (6). C. 57–60.
8. Liu T., Yan H., Zhai L. Extract relevant features from DEM for groundwater potential mapping // ISPRS - International Archives of the Photogrammetry, Remote Sensing and Spatial Information Sciences. 2015. (XL-7/W4). C. 113–119.
9. Meten M., PrakashBhandary N., Yatabe R. Effect of Landslide Factor Combinations on the Prediction Accuracy of Landslide Susceptibility Maps in the Blue Nile Gorge of Central Ethiopia // Geoenvironmental Disasters. 2015. № 1 (2). C. 9.
10. Mishurova U., Krivoguz D. Risk analysis of the influence of the population of Mugil Cephalus population of Phalacrocorax Carbo with the Monte Carlo method // International Journal of Professional Science. 2017. (4). C. 44–51.
11. Möller M. [и др.]. Plausibility test of conceptual soil maps using relief parameters // CATENA. 2012. № 1 (88). C. 57–67.
12. Nefeslioglu H.A. [и др.]. Assessment of Landslide Susceptibility by Decision Trees in the Metropolitan Area of Istanbul, Turkey // Mathematical Problems in Engineering. 2010. (2010). C. 1–15.
13. Shubina D.D., Fomenko I.K., Gorobtsov D.N. The Specifities of Landslides Danger Assessment Accepted in Eurocode // Procedia Engineering. 2017. (189). C. 51–58.
14. Sidle R.C., Ochiai H. Landslides: Processes, Prediction, and Land Use / R.C. Sidle, H. Ochiai, 2013. 312 c.
15. Sørensen R., Zinko U., Seibert J. On the calculation of the topographic wetness index: evaluation of different methods based on field observations // Hydrology and Earth System Sciences. 2006. (10). C. 101–112.
16. Yao X., Tham L.G., Dai F.C. Landslide susceptibility mapping based on Support Vector Machine: A case study on natural slopes of Hong Kong, China // Geomorphology. 2008. № 4 (101). C. 572–582.
17. Zevenbergen L.W., Thorne C.R. Quantitive analysis of land surface topography // Earth Surface Processes and Landforms. 1987. № 1 (12). C. 47–56.