
Observability of high-load SaaS platforms: tracing, metrics, and logging for reducing incident resolution time
The article examines observability in high-load SaaS platforms as an integrated framework of monitoring, diagnosis, and post-incident analysis. It is shown that in distributed digital environments, traditional monitoring does not provide sufficient depth for the rapid localization of the causes of degradation and failure. The diagnostic potential of metrics, distributed tracing, and structured logs at different stages of incident investigation is analyzed. Approaches to the architectural organization of platform observability are considered, including telemetry data standardization, signal alignment, data sampling, and label cardinality control. The article also examines practices of alerting configuration, dashboard organization, and post-incident analysis. It is concluded that observability serves as a key mechanism for reducing MTTR and lowering the recurrence of failures in high-load SaaS systems.
observability, SaaS platforms, distributed tracing, application metrics, structured logs, MTTR, incident management
As digital services become more distributed and the architecture of high-load SaaS platforms grows more complex, operational resilience increasingly depends on the quality of system observability. Traditional monitoring approaches, focused mainly on infrastructure indicators and isolated control of individual components, are no longer sufficient for timely detection of performance degradation, cascading failures, and hidden interservice anomalies. In microservice-based and event-driven environments, an incident rarely remains confined to a single node or application; it often emerges at the intersection of network interactions, message queues, dependent APIs, caching mechanisms, and internal business operations. For this reason, observability is increasingly viewed not as an auxiliary monitoring tool, but as an integrated framework for collecting, correlating, and interpreting operational data in order to accelerate diagnosis and improve platform manageability.
Within this framework, distributed tracing, application metrics, and structured logs are of particular importance, since together they make it possible to reconstruct the actual path of a request, detect abnormal service behavior, and reduce root-cause localization time. On the other hand, the operational efficiency of the observability methodology does not depend solely on the presence of telemetry but also on the level of its architectural structuring, correlation of signals, and readiness of response processes, such as alerting, dashboarding, runbooks, and post-incident reviews. The objective of the paper is to analyze the observability of highly loaded SaaS systems as an integrated approach to monitoring, diagnostics, and post-incident analysis, and to determine methods that can contribute to faster incident resolution and decrease the likelihood of recurrence.
- Incidents in high-load SaaS platforms: architectural complexity and the limits of traditional monitoring
In the operation of high-load SaaS platforms, an incident should be understood not as an isolated failure of a single component, but as a disruption of the system’s normal state that leads to degradation in availability, performance, or the correctness of user-facing and internal business operations [1]. In a distributed architecture, such a disruption usually emerges not at the level of one isolated element, but as a result of lost consistency across multiple services, message queues, API interactions, caching layers, and external dependencies.
Recent industry data confirm that incidents in modern distributed environments are not exceptional events, but a regular part of operational practice. According to the 2025 SRE Report, 40% of organizations reported experiencing between 1 and 5 incidents during the 30 days preceding the survey (fig. 1).
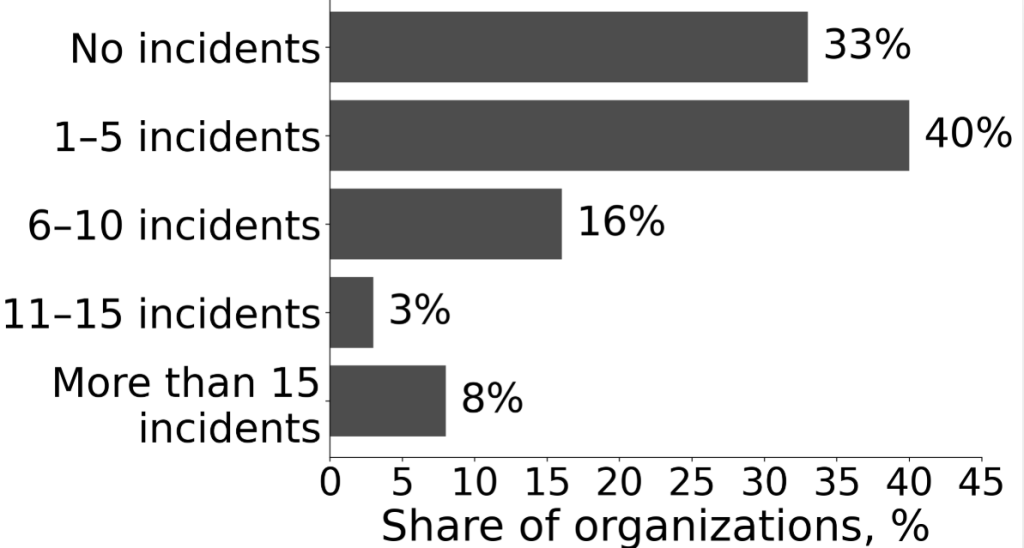
Figure 1. Distribution of organizations by the number of incidents recorded during the 30 days preceding the survey, according to the 2025 SRE Report [2]
Under these conditions, the concept of an incident extends beyond complete service outage. Partial system degradation, increased latency, a higher error rate in specific user scenarios, and disruptions in the consistency of business operations also acquire substantial operational significance. In distributed SaaS platforms, such forms of disruption are often the most typical, as they can materially reduce the actual quality of service even when formal availability is preserved. For example, similar relationships have been noted in studies of Linux-based high-load service environments, where operational stability is directly linked to the efficiency of low-level resource management, including memory behavior under sustained load [3].
Traditional monitoring is insufficient primarily because it is historically focused on aggregated infrastructure indicators and predefined failure scenarios. By contrast, observability is intended to support questioning the system without full prior knowledge of its internal state and to reveal previously unknown failure patterns. This requires applications to generate traces, metrics, and logs that are sufficient for diagnosing not only common but also previously unknown problems. In this context, distributed tracing becomes particularly important, as it makes it possible to follow a request across a complex distributed system and analyze issues that cannot be reproduced locally.
The limitations of traditional monitoring are further intensified by tool fragmentation and the high number of context switches during incident investigation. According to Grafana, by 2025 organizations used an average of eight observability tools, whereas survey participants reported 101 observability tools; meanwhile, the number of data sources within Grafana was 16 on average and rose to 24 in firms with more than 5,000 workers. In such an environment, operators often see not a coherent cause-and-effect chain, but fragmented signals: latency spikes in one tool, rising error rates in another, and indirect symptoms in a third. As a result, root-cause localization becomes slower, while dashboard-based monitoring increasingly substitutes diagnosis with a set of disconnected views.
Finally, another fundamental limitation of traditional monitoring is its weak suitability for managing recovery and resilience after production changes. Modern DORA metrics assess stability not through abstract uptime, but through failed deployment recovery time, change fail rate, and deployment rework rate, that is, through the system’s ability to recover quickly from unsuccessful changes and minimize unplanned corrective work. This is especially important for SaaS platforms, where many incidents are caused not by hardware failures, but by releases, configuration changes, and shifts in service behavior. In this context, reactive alerting without trace context, structured logs, and service-oriented metrics leads to alert fatigue. According to Splunk, in 2025, 43% of specialists reported spending too much time responding to alerts (fig. 2).
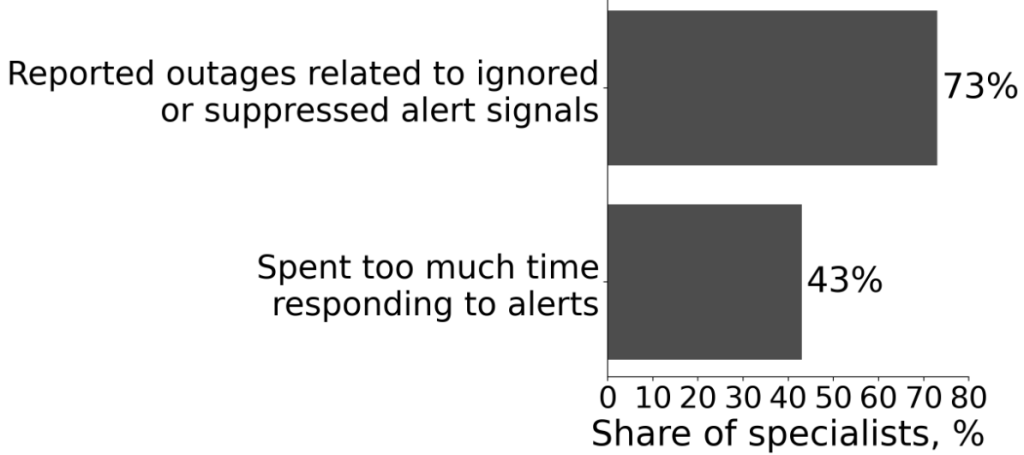
Figure 2. Selected indicators of alert fatigue and its operational consequences,
according to Splunk, 2025 [4]
These data indicate that, for high-load SaaS platforms, the key objective is to move beyond isolated state monitoring toward observability as an integrated framework that connects telemetry signals, architectural context, and incident response procedures.
Thus, the growing architectural complexity of high-load SaaS platforms shifts the focus from conventional monitoring of isolated states to the analytical use of correlated telemetry. In this context, distributed tracing, metrics, and structured logs should be examined as complementary sources of diagnostic evidence, each contributing differently to incident detection, scoping, and root-cause investigation.
- Diagnostic potential of distributed tracing, metrics, and logging
Modern observability platforms assume that sufficient visibility is achieved not through a single type of telemetry, but through the combined use of metrics, logs, and distributed traces, since each of these signals captures a different aspect of system behavior and provides distinct diagnostic value. In incident investigation, they do not substitute for one another, but form a complementary analytical framework: metrics help detect abnormal behavior, tracing helps localize the affected part of the system, and logs help confirm and interpret the specific cause of failure (table 1).
Table 1
Diagnostic roles of metrics, traces, and logs in incident investigation [5, 6]
| Signal type | Primary diagnostic role | Most useful stage of investigation | Typical analytical value |
| Metrics | Detection of abnormal system behavior. | Detection, initial scoping. | Reveal latency growth, error rate increase, throughput drop, saturation, queue buildup. |
| Distributed traces | Reconstruction of request path across services. | Root-cause localization, dependency analysis. | Identify bottlenecks, critical path segments, latency propagation, interservice failures. |
| Structured logs | Verification and interpretation of specific failure events. | Root-cause confirmation, remediation. | Show exceptions, error codes, timeout events, rejected operations, retry outcomes. |
Taken together, these telemetry signals make it possible to move from isolated symptom detection to a more structured reconstruction of the incident mechanism. In high-load SaaS environments, where failures often propagate across multiple services and technical layers, the diagnostic value of observability lies not in any single signal, but in their coordinated use within a unified operational context. This makes incident investigation more consistent, reduces dependence on manual hypothesis checking, and improves the accuracy of root-cause identification, especially in cases of short-lived, intermittent, and difficult-to-reproduce failures.
Accordingly, the practical diagnostic value of observability depends not only on the presence of heterogeneous telemetry signals, but also on the architectural conditions under which they are collected, correlated, and interpreted within a unified analytical framework.
- Designing observability platforms: telemetry collection, signal correlation, and data standardization
An observability platform in a high-load SaaS environment should be treated not as a collection of separate tools, but as an architecturally organized telemetry framework suitable for real-time diagnosis and post-incident analysis. Its effectiveness depends not only on the presence of traces, metrics, and logs, but also on consistent data standardization, signal collection and routing, sampling and cardinality control, and correlation of telemetry streams within a unified operational context. For this reason, observability should be designed as a multi-layered system in which each architectural stage affects diagnostic completeness, investigation reproducibility, scalability, and operational cost (table 2).
Table 2
Architectural stages of observability platform design in high-load SaaS environments [7, 8]
| Architectural stage | Core objective | Main implementation focus | Operational significance |
| Data standardization | Ensure semantic consistency of telemetry. | Unified attributes, naming rules, semantic conventions. | Enables consistent interpretation and correlation of signals. |
| Signal collection and routing | Organize controlled telemetry ingestion and delivery. | Collectors, pipelines, filtering, enrichment, export logic. | Reduces fragmentation and supports stable telemetry flow. |
| Sampling and cardinality control | Balance diagnostic depth and resource cost. | Head/tail sampling, label control, aggregation policies. | Preserves useful signals while limiting storage and processing overhead. |
| Signal correlation in operational context | Make telemetry actionable for diagnosis and investigation. | TraceId, SpanId, resource attributes, service and environment context. | Supports root-cause analysis, reproducibility of investigation, and MTTR reduction. |
The presented architectural logic shows that observability in a high-load SaaS environment cannot be reduced to the simple accumulation of telemetry data. The diagnostic value of signals depends on how consistently they are embedded in a unified system of naming, routing, selection, and correlation. Without such consistency, even large volumes of traces, metrics, and logs do not produce a coherent view of an incident, but instead increase the amount of fragmented technical information requiring manual interpretation. Therefore, the architectural maturity of an observability platform is expressed primarily in its ability to ensure signal comparability and continuity of context from event occurrence to incident analysis.
It is equally important that each of these stages affects not only diagnostic completeness, but also the operational sustainability of the observability platform itself. Insufficient standardization hinders data correlation, uncontrolled collection increases noise and cost, and the lack of a well-designed linkage between signals reduces the reproducibility of incident investigation. As a result, an observability platform should be designed as a dual-purpose engineering system: on the one hand, it provides the technical foundation for failure detection and analysis; on the other hand, it creates the organizational conditions for MTTR reduction, scalable telemetry use, and greater reliability of the operational environment as a whole. In this sense, the architectural quality of observability directly determines whether telemetry remains a passive data stream or becomes an effective basis for incident investigation and operational response.
- Operational practices for MTTR reduction: alerting, dashboards, runbooks, and post-incident analysis
Reducing incident resolution time in practice requires observability data to be transformed into a managed operational workflow rather than merely collected. In high-load SaaS platforms, this function is performed through the combination of alerting, dashboards, runbooks, and post-incident analysis, since the availability of traces, metrics, and logs alone does not guarantee rapid recovery. This approach is particularly important in SaaS environments, where a substantial share of failures is caused not by hardware faults, but by releases, configuration changes, and integration errors.
At the first level of the operational framework, the quality of alerting plays a decisive role. An excessive number of signals, weak prioritization, and low detection accuracy produce alert fatigue, in which notifications cease to accelerate response and instead compete for engineers’ attention. This means that alerting architecture should be built not around maximizing the number of notifications, but around identifying genuinely action-worthy events associated with user impact, the risk of SLO violation, and confirmed anomalies in service metrics.
The practical significance of a centralized observability framework is also supported by operational benchmarks. The Grafana Observability Survey 2025 cites the example of a large technology company where observability centralization reduced MTTR by 40% and saved an average of 15 engineering hours per incident. For a high-load SaaS platform, this is particularly important, since the value of observability depends not only on the completeness of signals, but also on the speed of transition from an alert to a coherent diagnostic context in which the team can quickly assess the blast radius, affected services, and the likely mechanism of degradation.
Dashboards in this framework serve not a presentational but a navigational and diagnostic function. Their role is to move the team quickly from the fact of degradation to a structured view of the incident, including latency, error rate, saturation, queues, affected services, and user scenarios. The technical value of this configuration is also reflected in typical operational thresholds: for example, New Relic documentation describes an alerting condition in which an incident is triggered when total application response time exceeds 5 seconds for 5 minutes [9]. This shows that, in mature observability practice, a dashboard should do more than display metrics; it should enable a rapid transition from a threshold breach to the context of the service, the release, and the user impact. For this reason, effective dashboarding in SaaS platforms should be hierarchical, moving from high-level user-impact and SLO indicators to service-level and detailed operational views linked to trace and log context. Only in such a configuration does a dashboard become a triage tool rather than a passive metric display.
Finally, sustained MTTR reduction is impossible without post-incident analysis, which turns an isolated failure into a source of systemic improvement. Such review should capture not only the immediate technical cause, but also the chain of conditions that allowed the incident to occur, including insufficient alerting, missing dashboard views, logging gaps, incomplete traces, outdated runbooks, or unclear ownership across teams. In this sense, observability becomes a tool not only for detection, but also for organizational learning. The economic significance of this approach is also confirmed by industry benchmarks (table 3).
Table 3
Economic effect of mature observability practices according to the New Relic
Observability Forecast 2025 [10]
| Indicator | Organizations with mature full-stack observability | Other organizations | Analytical significance |
| Average cost of a high-impact outage, USD/hour | 1,000,000 | 2,000,000 | Mature observability practices are associated with an approximately twofold reduction in direct losses from major incidents. |
| Relative scale of outage-related losses | 0.5× | 1.0× | Confirms that observability affects not only diagnosis, but also the economics of recovery. |
Taken together, these benchmarks show that mature observability practices influence not only the speed of incident investigation, but also the economic consequences of service disruption. For high-load SaaS platforms, this means that alerting, dashboards, runbooks, and post-incident analysis should be treated as parts of a single operational cycle linking detection, diagnosis, response, and learning. Only under this condition does observability become not merely a monitoring capability, but a mechanism for reducing MTTR, limiting outage-related losses, and improving the resilience of the production environment.
- Conclusion
Observability in high-load SaaS platforms should be understood as an integrated framework of operational control that combines telemetry collection, diagnosis, incident response, and post-incident analysis. The analysis shows that in distributed digital environments, traditional monitoring, focused mainly on aggregated infrastructure indicators, does not provide sufficient depth for rapid localization of the causes of degradation and failure. Diagnostic effectiveness is achieved through the coordinated use of metrics, distributed tracing, and structured logs, which make it possible to move from symptom detection to reconstruction of the incident mechanism and identification of its root cause. At the same time, the practical value of observability depends not only on the availability of signals, but also on the quality of telemetry architecture, including data standardization, context correlation, controlled collection, and the suitability of signals for reproducible incident investigation.
It is equally important that observability in high-load SaaS systems performs not only a diagnostic, but also an operational and organizational function. Effective alerting, hierarchically structured dashboards, up-to-date runbooks, and formalized post-incident review together form a unified operational workflow that supports MTTR reduction, lowers the recurrence of failures, and limits the direct losses caused by service disruption. Therefore, a mature observability platform should be designed and used as a mechanism of engineering resilience in which technical observability capabilities are combined with response procedures and organizational learning. Such an approach makes it possible to treat observability not as a collection of monitoring tools, but as a systemic foundation for the reliability, scalability, and manageability of modern SaaS platforms.
References
1. Akpomedaye B, Wimmer H, 2025. Automated Incident Response Systems: Enhancing Efficiency and Accuracy in the Clouds. International IOT, Electronics and Mechatronics Conference, Singapore, Springer Nature Singapore, pp 149-167.
2. Catchpoint, 2025. The SRE Report 2025: Highlighting Critical Trends in Site Reliability Engineering. https://www.catchpoint.com/press-releases/the-sre-report-2025-highlighting-critical-trends-in-site-reliability-engineering. Accessed 10 April 2026
3. Otkidach I, 2026. Operational optimization of memory management in Linux-based high-load service environments. Cold Science 26: 28-39.
4. Splunk, 2025. Get the latest research: State of Observability 2025. https://www.splunk.com/en_us/form/state-of-observability.html. Accessed 10 April 2026
5. Esan O, 2024. Enhancing SaaS reliability: real-time anomaly detection systems for preventing operational downtime. International Journal of Engineering Technology Research & Management 8(12): 466-485.
6. Damarched MK, 2026. Harnessing Large Language Models and Agentic AI for Transformative Cloud Reliability and Incident Management: A Comprehensive Suggestive Review. Journal of Computer Science and Technology Studies 8(5): 43-81.
7. Sakinala K, 2025. Monitoring and observability for cloud-native applications. Journal of Computer Science and Technology Studies 7(8): 101-115.
8. Kotsakis G, Papaioannou C, Souflas T, Tsolkas D, Kakyris A, Gounas P, Stavropoulos P, 2025. Development and implementation of an architecture for cloud-based monitoring in machining, focusing on high performance applications. Procedia CIRP 133: 579-584. doi: 10.1016/j.procir.2025.02.099
9. New Relic, 2026. Getting started with New Relic and Terraform. https://docs.newrelic.com/docs/infrastructure-as-code/terraform/terraform-intro/. Accessed 12 April 2026
10. New Relic, 2025. 2025 Observability Report (Observability Forecast 2025). https://newrelic.com/resources/report/observability-forecast/2025. Accessed 13 April 2026