Introduction
In the context of the rapid growth of data volumes and increasing application complexity, the need for reliable tools to assess database performance is becoming increasingly significant. The quality of such monitoring directly touches not only stability but also possible problems that may manifest as performance degradation and can lead to failure. Databases today, whether on-premise or cloud, need some modern and innovative methods with specialized toolkits that promise very high performance while reducing their time to market or recovery in the event of an outage.
This paper aims to perform an analysis of the performance monitoring tools and methods of analysis that exist for databases, classify them, and point out the advantages and limitations of these. The investigation covered the built-in tools of database management system (DBMS) and third-party products, their function of detection and solution of performance issues, and their ability for integration into other systems.
Main part. Classification of database performance monitoring tools
Specialized tools are utilized to perform effective database performance monitoring. These tools can be divided into groups according to origin, functionality, methods of data collection, and scope of application [1].
Built-in monitoring tools are developed by DBMS providers and are designed to work exclusively within a specific platform. These solutions are deeply integrated with the DBMS core, providing access to internal metrics and database processes. They have the advantages of being native: they integrate better with the DBMS, data granularity is high, and no extra setup is required. These tools can be somewhat limiting when it comes to functionalities and scalability, especially in multi-platform environments.
Third-party monitoring tools are developed independently and include universal solutions that can work with different DBMS platforms. These tools are built up around maximum functionality: data visualization, trend analysis, and integration with DevOps systems. Third-party solutions, in general, are flexible and can run on multiple platforms, which is particularly relevant in the case of heterogeneous IT infrastructures. These tools may take considerable time for deployment and configuration.
Monitoring tools can differ in their data collection approaches: the choice of a specific method depends on the monitoring objectives, available resources, and required data granularity (table 1).
Table 1
Data collection approaches in database monitoring tools [2, 3]
| Data collection approach | Description | Examples and details |
| Agent-based collection | Uses software agents installed on the database server to collect performance metrics. | New Relic, DataDog – provide high-level detail but increase server load. |
| Agentless collection | Data is collected via built-in APIs or system logs. This approach reduces server load but may be less detailed. | Built-in API solutions, PostgreSQL logs – reduce server load but provide less detail. |
| Real-time monitoring | Continuous observation of database processes, allowing immediate issue detection and resolution. | Datadog, Prometheus – provide real-time metrics, useful for high-load systems. |
| Historical data analysis | Stores and processes data over a defined period for trend analysis and forecasting. | Datadog, Zabbix – allow trend analysis, useful for strategic planning. |
It provides an excellent classification of the benefits and shortcomings of each approach and helps to choose the best fit for a particular system or organization. Current trends are toward using hybrid and cloud-based monitoring tools due to their flexibility and ease in handling distributed infrastructures.
Performance analysis methods
Database performance analysis is a crucial component in ensuring the stability and efficiency of information systems. Properly selected analysis methods not only help identify existing issues but also predict potential bottlenecks in the system, preventing performance degradation (table 2).
Table 2
Metrics for database performance analysis
| Metric | Description |
| CPU utilization | Indicates the level of computational resource usage by the server running the database. |
| Response time | Measures the speed of query execution, including transaction processing and data transfer time. |
| Memory usage | Characterizes the use of RAM for temporary data storage and caching. |
| Throughput | Defines the volume of data processed by the database per unit of time. |
| Transaction latency | Describes delays in performing operations related to data writing and reading. |
These performance metrics provide insights into database efficiency that enable administrators to diagnose and address performance issues well before they can affect system stability. By continuously monitoring CPU utilization, response time, memory usage, throughput, and transaction latency, organizations can optimize resource utilization, improve query execution, and prevent potential bottlenecks. Additionally, this allows for the historical analysis of these metrics to forecast trends, helping businesses scale their infrastructure proactively to meet the demands that are growing. With databases continuing to handle volumes of data in increasing order of magnitude, leveraging these metrics in concert with automated monitoring and artificial intelligence (AI) driven analytics will hold the key to optimal performance and reliability.
Application of monitoring tools in different DBMS
Modern DBMS provide built-in monitoring tools specifically designed for their architectures and operational characteristics. These tools facilitate the collection of performance metrics, analysis of system efficiency, and problem diagnosis, making them an integral part of managing complex information systems.
For instance, Oracle Database utilizes Automatic Workload Repository (AWR) and Automatic Database Diagnostic Monitor for performance monitoring and analysis [4]. AWR automatically collects and stores key performance metrics, creating system snapshots every 60 minutes (by default). These snapshots capture data on CPU utilization, memory usage, active session count, transaction duration, and executed queries (fig. 1).
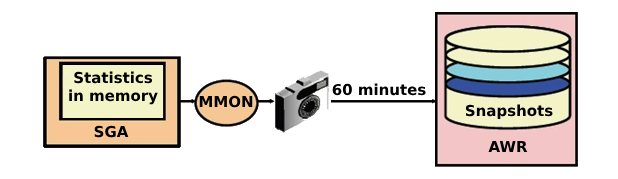
Figure 1. AWR scheme
The data is kept in the repository for a certain amount of time so that current and historical trends can be analyzed. AWR also generates reports pinpointing problems-such as slow queries, disk subsystem bottlenecks, or overloaded processors.
The Automatic Database Diagnostic Monitor (ADDM), which operates based on AWR data, automatically performs database performance diagnostics and generates recommendations for optimization (fig. 2).
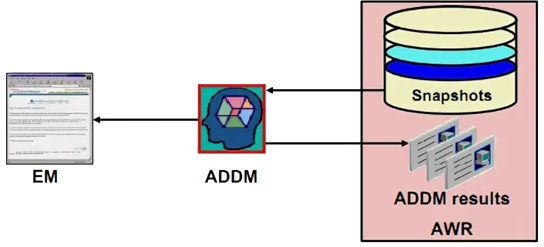
Figure 2. ADDM scheme
The collected metrics are analyzed by ADDM to identify the root causes of performance issues, such as lock contention, improper configuration of indexes, poor input/output performance, or overload of resources. Further, ADDM gives practical recommendations for optimization based on this analysis. Together, AWR and ADDM offer a powerful combination ranging from monitoring to diagnostics, therefore becoming an inseparable tool in managing high-load database systems.
Microsoft SQL Server has some inbuilt tools for the same, namely SQL Server Profiler and Extended Events, to enable administrators to monitor database performance, analyze query behavior, and identify system issues [5]. SQL Server Profiler is a traditional tracing tool used to record the events of a database, including SQL query execution, table modifications, locks, and transaction delays. It gives detailed query analysis by tracing execution time, the number of rows processed, and index usage. Because of this, it is particularly handy in troubleshooting slow queries and performance optimization. However, prolonged use of SQL Server Profiler can create a significant system load, limiting its applicability in high-performance environments.
Extended Events is a more advanced, flexible diagnostic tool intended to supersede Profiler. It makes possible the selecting and collection of only the most relevant events by the administrator, minimizing system overhead. Working on the principle of asynchronous logging, the extended events are more efficient than Profiler in monitoring query execution, user activities, server configuration changes, and performance-related problems. It works with SQL Server Management Studio for visual data representation.
This tool is highly effective at determining complex issues such as long-running locks, parallel transactions, and system-wide failures. It also grants the capability of explaining stored procedures execution, CPU usage, and memory consumption, therefore it is also a great solution for deep performance analysis.
PostgreSQL has pg_stat_statements and pgAdmin as monitoring utilities [6]. Pg_stat_statements gathers statistics about executed queries, including the number of executions, total time taken, and resources used by the queries, thus helping to identify the most resource-intensive operations. On the other hand, pgAdmin is a graphical interface to monitor and manage PostgreSQL, with load analysis and system configuration capabilities.
MySQL has special tools for performance monitoring and analysis, such as Performance Schema and MySQL Enterprise Monitor, which allow the administrator to get detailed information on the state of the database system, find bottlenecks, and further optimize its performance [7]. Performance Schema a built-in monitoring mechanism-collects low-level data about internal database processes without high system overhead (fig. 3).
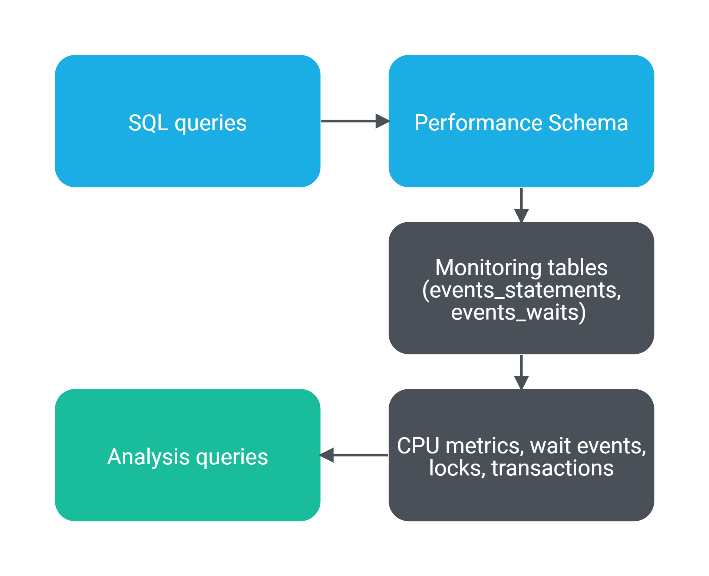
Figure 3. Performance Schema
Another of the major benefits of Performance Schema is its flexibility: it enables administrators to enable and disable the gathering of certain metrics, hence controlling the granularity of the data. This tool also performs query performance analysis, such as average execution time and index usage frequency, which becomes important for query optimization, especially in the case of slow ones.
MySQL Enterprise Monitor offers a more comprehensive monitoring solution, incorporating data visualization, automated analysis, and alerts for potential issues (fig. 4).
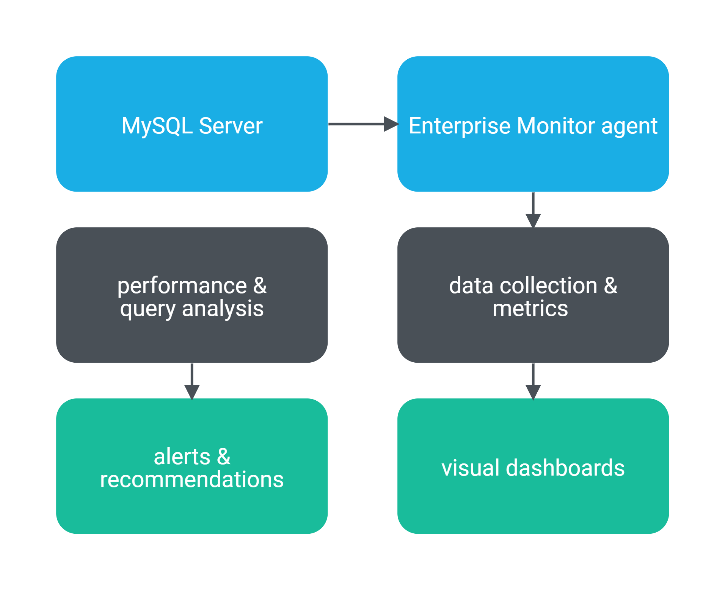
Figure 5. MySQL Enterprise Monitor scheme
This tool offers a user-friendly web interface that allows administrators to view real-time data about system load, connection activity, and performance metrics. Unlike Performance Schema, which requires working with SQL queries for data analysis, MySQL Enterprise Monitor automatically creates graphs and reports, making diagnostics and trend analysis much easier when evaluating performance.
Besides native monitoring tools, third-party solutions play a key role in database performance management, especially in complex environments. Designed for cross-platform use, advanced analytics, and customization, tools like Zabbix, Prometheus, Datadog, and New Relic integrate well with various database systems and IT infrastructures. Zabbix enables full-stack monitoring of databases, servers, and networks through centralized dashboards for real-time system health tracking. Prometheus specializes in time-series data collection and, when paired with Grafana, provides powerful database performance visualization. Datadog and New Relic leverage AI and machine learning for anomaly detection, problem prediction, and performance bottleneck analysis. These tools are particularly valuable for multi-cloud and hybrid environments, ensuring seamless database performance. Their flexibility, automation, and DevOps integration make them essential for proactive monitoring, rapid issue detection, and continuous optimization.
Practical aspects of implementing monitoring systems
Implementation of database monitoring systems is complex and complicating work that ensures stability, performance, and predictability of information systems. Successful deployment requires consideration of a number of key aspects, starting from the selection and configuration of a tool to its integration with the existing infrastructure and automation.
Among the initial steps is choosing the appropriate monitoring tool, which relies on the requirements of the system, type of DBMS in use, and resources. After selection, it has to be installed and configured; installation will differ based on the environment it will be deployed in. In case of on-premises DBMS, it will be about performance parameters tuning, enabling the necessary modules, and integrating with visualization tools. For instance, MySQL Performance Schema requires enabling metric collection, while in SQL Server Extended Events, special sessions need to be created that will monitor the activity. Monitoring set up in cloud environments involves connecting to cloud services, creating dashboards, and setting up automated alerts. As an example, AWS CloudWatch provides a possibility to configure metrics and set up notification triggers for critical thresholds.
To enhance monitoring efficiency, it should be integrated with logging systems and DevOps platforms for unified data collection, thus enabling automated issue detection. Tools like Grafana make it easy to create real-time dashboards, while Zabbix and Datadog allow the creation of automated alerts when performance degradation is detected.
Another important feature is monitoring automation, which enables prompt reaction in case of a potential failure and reduces human involvement. This involves setting threshold values for critical metrics; for instance, automatic notification in case of CPU usage exceeding 80%. In addition, predictive analytics mechanisms will analyze past trends to predict issues such as increased execution time of queries or increased load on the system.
Once monitoring is implemented, continuous analysis and adaptation are necessary. Regular review of reports allows for the identification of long-term trends, such as increased query response times or a growing number of connections. Based on this data, database optimization can be done, including indexing slow queries, reallocation of resources, or modification of configuration settings.
Thus, the successful implementation of database monitoring systems involves an overall approach: tool selection, proper configuration, integration with IT systems, and automation. This would lead to a definite improvement in performance and reliability, less downtime, and lower administration costs for the databases.
Prospects for the development of monitoring tools
Database monitoring systems continue to evolve, adapting to growing data volumes, advancements in cloud technologies, and increasing demand for automation [8]. The key directions in their evolution include the integration of AI, process automation, and multi-cloud environment support.
Moving down, machine learning for predictive analytics, further down the line, will allow us to see overloads and failures far in advance and provide an automatic solution. Systems like Datadog, AWS CloudWatch, and New Relic apply AI algorithms today to detect anomalies and predict problems. In years to come, databases will self-optimize queries, workloads dynamically redistribute their workloads, and bottlenecks get avoided with minimal administrator’s intervention.
Another is observability, which is a growing demand and involves monitoring, query tracing, and logging with real-time analytics and stream processing technologies like Apache Kafka and Spark Streaming. All these will help to analyze workload fluctuations and transaction delays instantly, keeping the system stable. Therefore, database monitoring of the future would be about automation, cloud integration, and AI-driven solutions for the creation of more autonomous and intelligent systems.
Conclusion
Database performance monitoring and analysis tools are an essential attribute of contemporary IT infrastructure, which ensures stability, efficiency, and predictability of a system. From the built-in tool to the third-party platform, it can be adapted for a wide range of solutions for different tasks and environments, whether for on-premises or cloud infrastructures.
Modern monitoring technologies keep on developing, offering increasingly intelligent, automated, and integrated approaches. Successful implementation will also reduce administration costs while contributing to the development of more resilient and flexible information systems that are better able to meet the challenges presented by continuous growth in data volume and more and more complex business processes.
References
1. Altaher R. Transparency Levels in Distributed Database Management System DDBMS. 2024. DOI: 10.20944/preprints202404.1327.v12. Dudak A. Virtualization and rendering of large data lists // Cold Science. 2024. № 9. P. 17-25. EDN: QUGQBQ
3. Zekhnini K., Chaouni Benabdellah A., Cherrafi A. A multi-agent based big data analytics system for viable supplier selection //Journal of Intelligent Manufacturing. 2024. Vol. 35. №. 8. P. 3753-3773. DOI: 10.1007/s10845-023-02253-7 EDN: LORQFU
4. Arb G. I. Oracle Database Performance Improvement: Using Trustworthy Automatic Database Diagnostic Monitor Technology //Computer Science. 2024. Vol. 19. №. 3. P. 881-892.
5. Kumar T. V. A Comparison of SQL and NO-SQL Database Management Systems for Unstructured Data. 2024.
6. Ravshanovich A. R. Database structure: PostgreSQL database //Psixologiya va sotsiologiya ilmiy jurnali. 2024. Vol. 2. №. 7. P. 50-55.
7. Ravi Kumar Y. V., Samayam A. K., Miryala N. K. MySQL Enterprise Monitor //Mastering MySQL Administration: High Availability, Security, Performance, and Efficiency. Berkeley, CA : Apress, 2024. P. 627-659.
8. Garifullin R. Development and implementation of high-speed frontend architectures for complex enterprise systems // Cold Science. 2024. №12. P. 56-63. EDN: ZZUNWR